
Steffen Ullmann
Senior Portfolio Manager – Investment Grade
It was a time of great hopes and bold visions: When the euro saw the light of day a quarter of a century ago, its architects dreamed of a currency that would stand up to the dollar. Today, 25 years later, the evolution of the euro investment grade market tells a fascinating story – albeit one with surprising twists and turns and a thoroughly ambivalent finale.
From niche to global player
The statistics are impressive: a twelve-fold increase in market volume since the turn of the millennium. However, this impressive figure conceals a fundamental structural change in the European economy. Traditional “Rhenish capitalism” based on bank loans is increasingly giving way to a capital market-oriented model. However, with average growth of 9% per year for corporate bonds, this change is taking place at a thoroughly European pace – evolutionary rather than revolutionary.
25 years of expansion
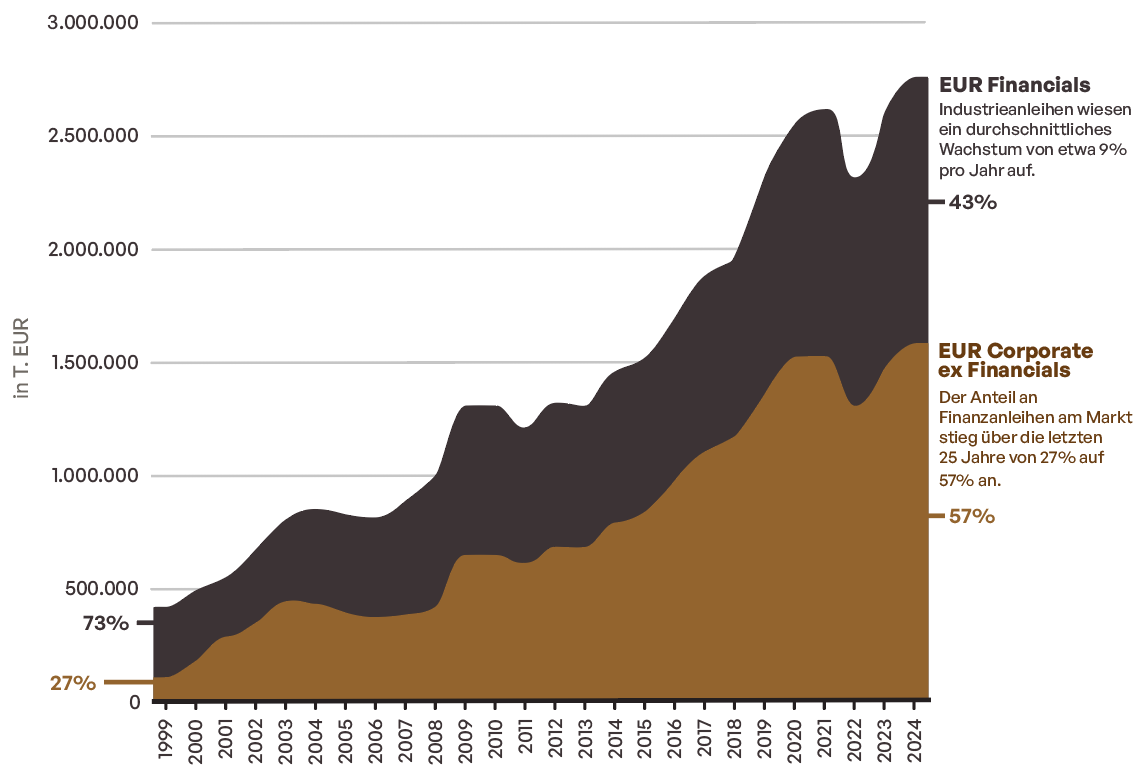
Source: Bloomberg, EUR Corporate ex Financials (LECFTREU Index) and EUR Financials (LEEFTREU Index); as at 31.12.2024.
A mirror of the zeitgeist
A study of the sectoral development of the market reveals a fascinating contemporary document of European economic history. The decline of the communications sector from a market share of over 30% of industrial bonds at the turn of the millennium to almost 10% reads today like a lesson in shattered dreams: Europe’s failed ambitions to play a leading role in the digital revolution.
Structural shifts
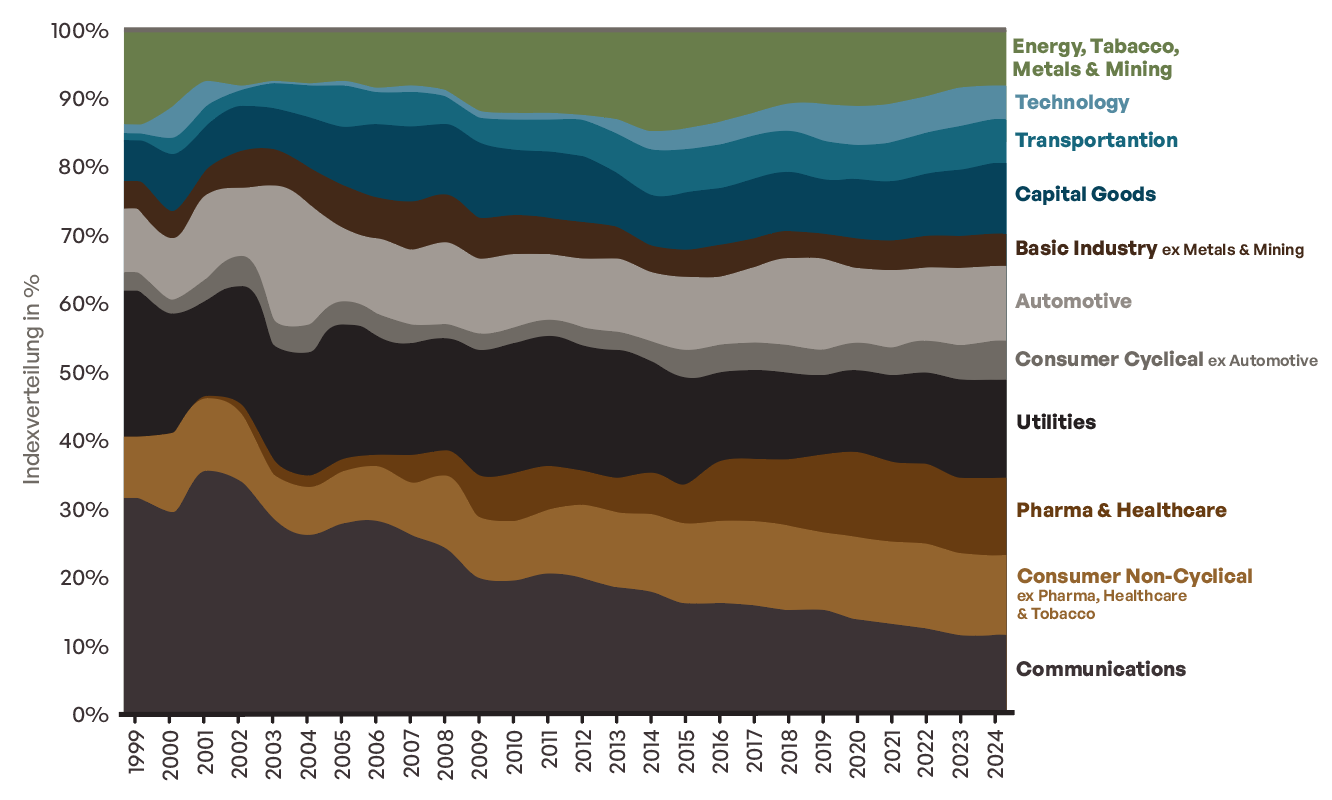
Source: Bloomberg, EUR Corporate ex Financials (LECFTREU Index)Own calculation, as at 31.12.2024
Instead, the healthcare sector dominates today – a triumph of the “old economy”? Not at all. Rather, it reflects the innovative strength of the European pharmaceutical industry, coupled with the challenges of an ageing society. The durability of the automotive sector despite the diesel scandal and chip crisis is evidence of astonishing resilience – which is currently being put to the test. Another notable trend is the influence of ESG criteria on sector composition. Since 2016, the share of the energy sector has been declining, with this trend only being temporarily halted during the Covid-19 pandemic. In addition, sectors such as tobacco, which are avoided by many investors, have almost completely left the market.
The two faces of credit quality
The development of the ratings reveals an interesting dichotomy: while industrial companies defended their creditworthiness with the tenacity of a Swiss watch, financial institutions experienced a veritable devaluation. This drifting apart tells more than just a story of risk management – it is a lesson about the tectonic shifts in the European financial system. The financial crisis marked a turning point: It heralded the end of the AAA rating era and established BBB as the new standard in the financial sector. The fact that the Covid-19 pandemic surprisingly did not trigger any further rating downgrades, but on the contrary even ushered in a renaissance of single A ratings from 2022, is testament to the astonishing adaptability of the European economy – or perhaps also to the increasing pragmatism of the rating agencies.
Divergence between financial & corporate bonds
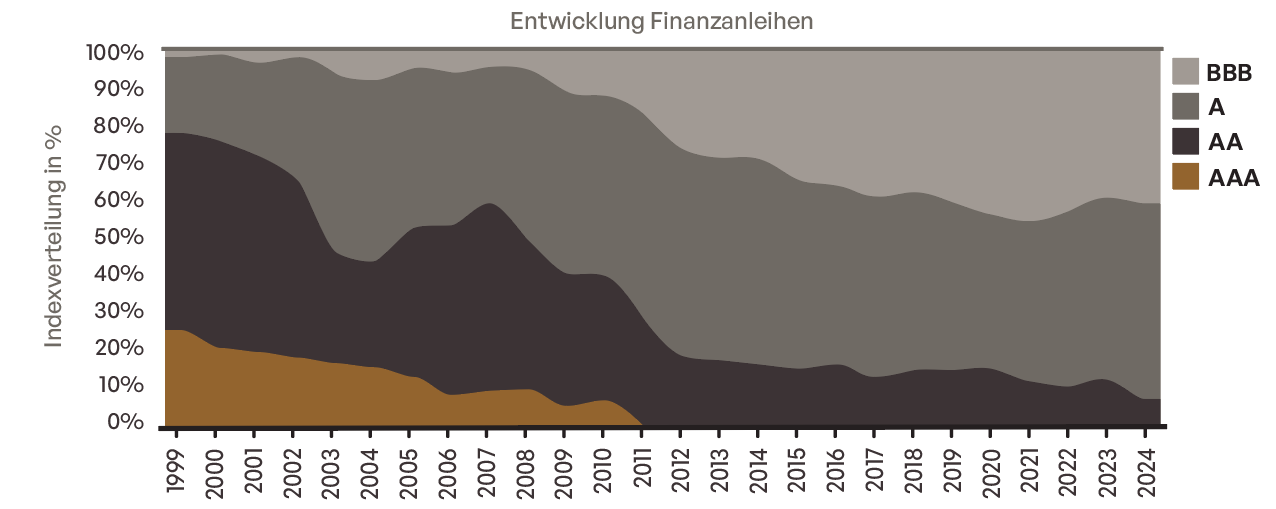
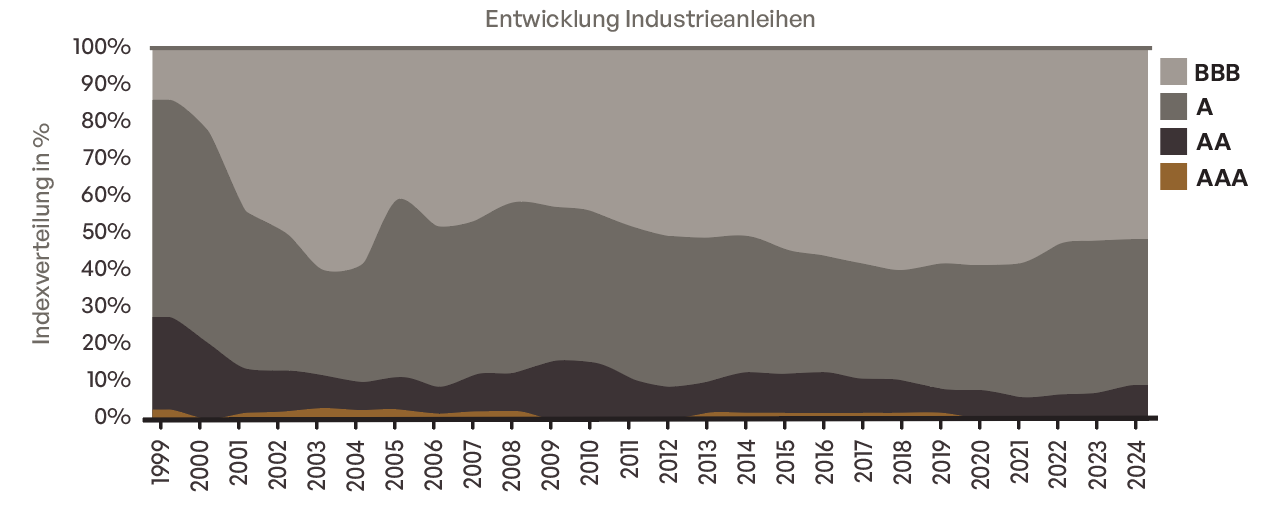
Source: Bloomberg, Bloomberg Euro-Aggregate: Industrials Aaa (I10361EU Index), Bloomberg Euro-Aggregate: Industrials Aa (I10360EU Index), Bloomberg Euro-Aggregate: Industrials A (I10359EU Index), Bloomberg Euro-Aggregate: Industrials Baa (I10362EU Index), Bloomberg Euro-Aggregate: Finance – Aaa (I02203EU Index), Bloomberg Euro-Aggregate: Finance – Aa (I02204EU Index), Bloomberg Euro-Aggregate: Finance – A (I02205EU Index), Bloomberg Euro-Aggregate: Finance – Baa (I02206EU Index); own calculation; as at 31.12.2024.
Term: The missed opportunity of long-term financing
But perhaps the most interesting aspect of this 25-year history is a seeming paradox: in an era of historically low interest rates, surprisingly few issuers have ventured into the ultra-long maturity space. Was it a lack of courage? Or rather a subtle signal of mistrust in the long-term stability of the eurozone? The truth probably lies somewhere in between – a typically European mixture of caution and persistent skepticism.
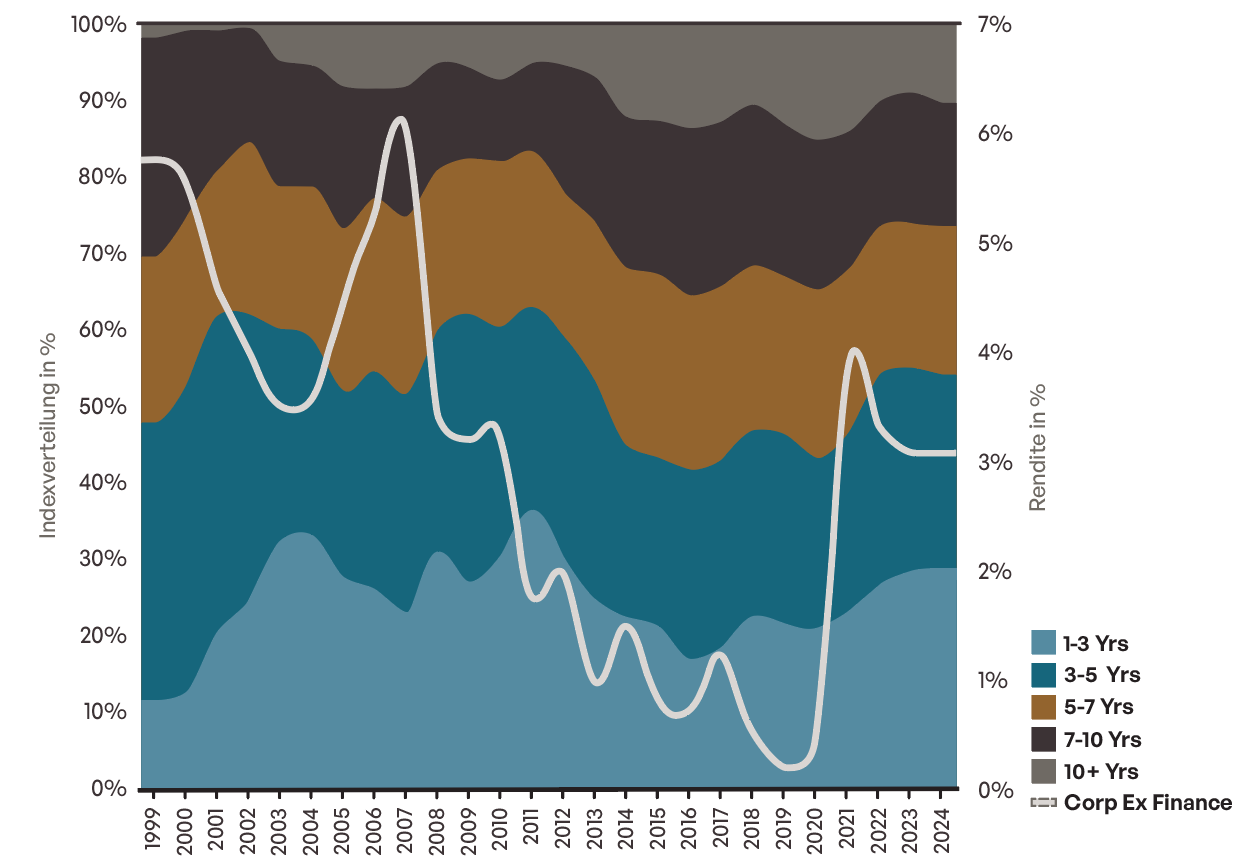
Source: Bloomberg, Bloomberg Euro-Aggregate: Industrials 1 – 3 Yrs (I10344EU Index), Bloomberg Euro-Aggregate: Industrials 3 -5 Yrs (I10345EU Index), Bloomberg Euro-Aggregate: Industrials 5 – 7 Yrs (I10346EU Index), Bloomberg Euro-Aggregate: Industrials 7 – 10 Yrs (I10347EU Index) and Bloomberg Euro Aggregate Industrials 10+ Year (I10348EU Index); own calculation; as at 31.12.2024.
Europe’s creeping transformation
Probably the most remarkable – and possibly most worrying – development is the increasing internationalization of the market. The proportion of non-European issuers has risen from around 20% to over 40%, with US companies in the role of the laughing third. What at first glance appears to be a success – after all, it testifies to the global attractiveness of the euro market – raises uncomfortable questions on closer inspection: Is Europe in the process of transforming itself from a production location to a pure financing platform?
Growing influence of international issuers
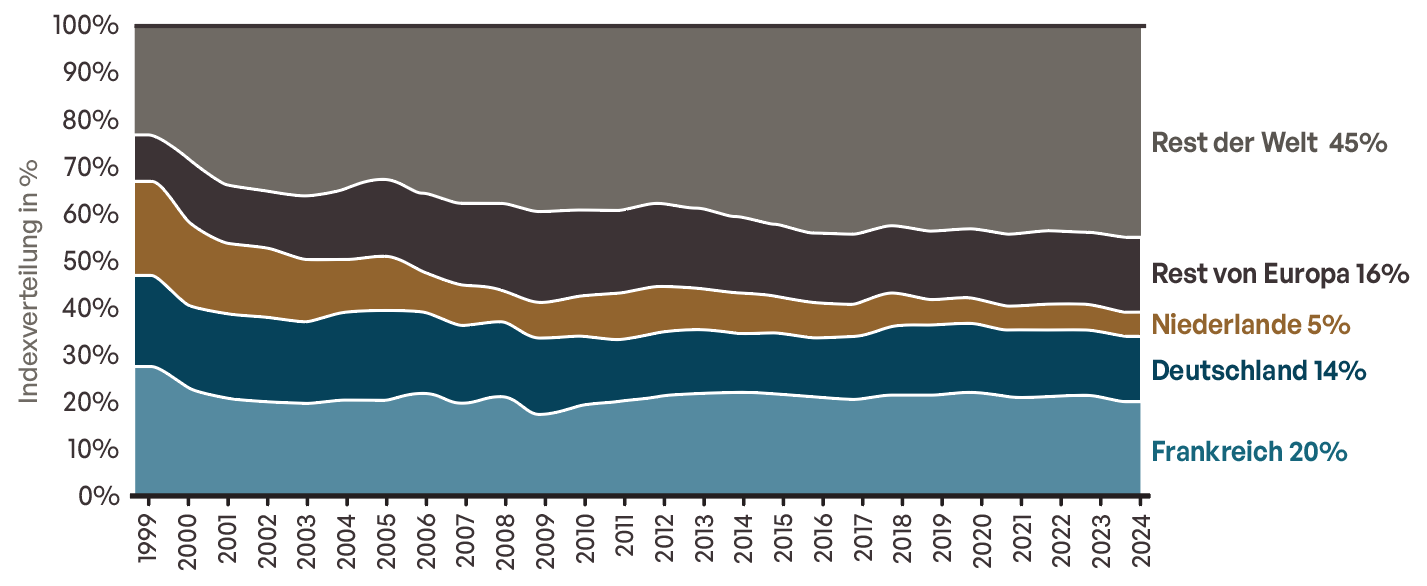
Source: Bloomberg, EUR Corporate (LECPTREU Index); own calculation; as at 31.12.2024.
The largest issuers are becoming less and less important over time

Source: Bloomberg, EUR Corporate ex Financials (LECFTREU Index); own calculation; as at 31.12.2024.
The stability of the largest European issuers over the years could be interpreted as an indication of a certain economic torpor. While the USA and Asia are surfing from one wave of innovation to the next, Europe seems to be settling into the role of a solid but somewhat sluggish financier.
The 10 largest European issuers
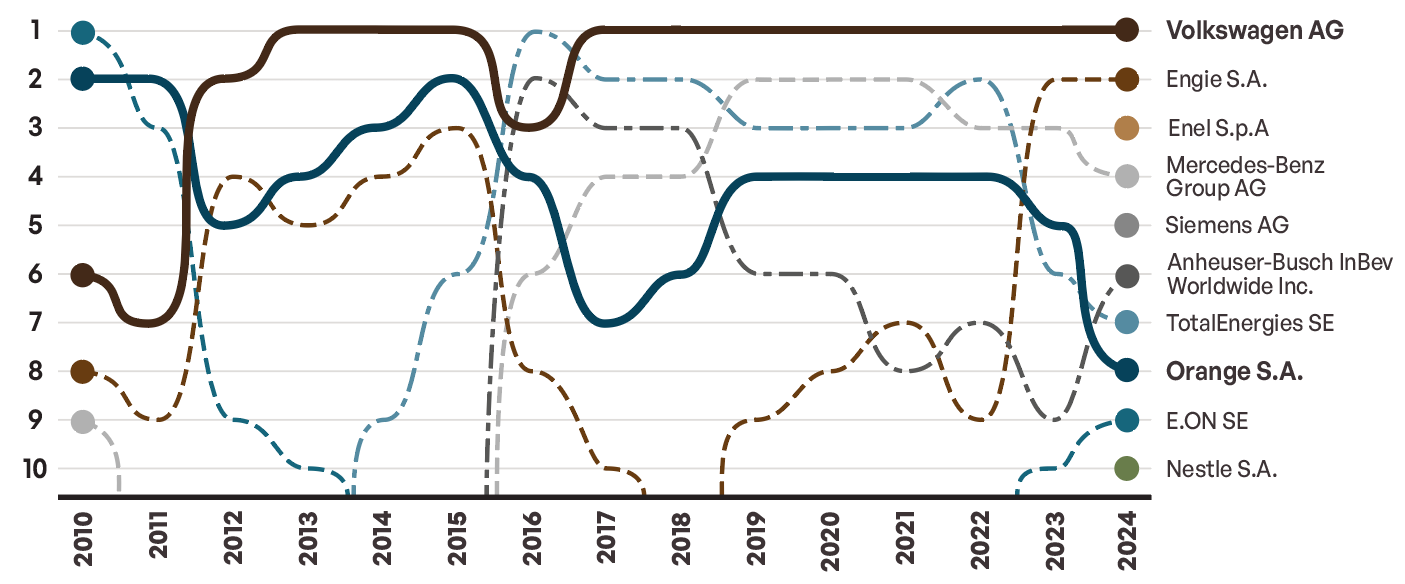
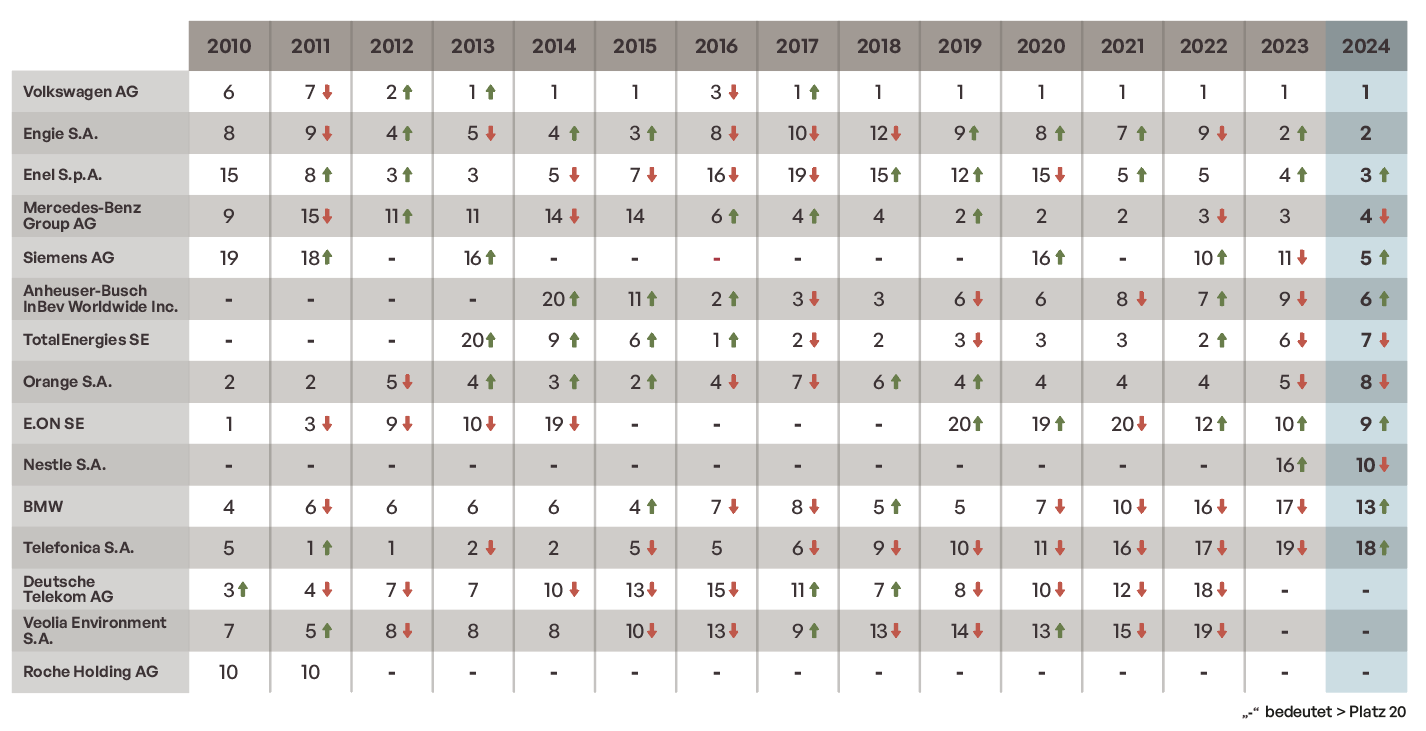
Source: Bloomberg, EUR Corporate ex Financials (LECFTREU Index), as at 31.12.2024
Over the past 14 years, only the issuers Volkswagen AG and Orange S.A. have been consistently represented in the top 10 largest issuers. Engie S.A., Mercedes Benz Group AG and E.ON SE were already in the top 10 14 years ago, but slipped down in between and were therefore not consistently represented. Enel S.p.A., Siemens AG, Anheuser-Busch, Total Energies SE and Nestle S.A. were not yet in the top 10 in 2010, but are now included. BMW and Telefonica S.A. were part of the ranking for a long time, but are no longer included.
Conclusion
After 25 years, the EUR investment grade market is symbolic of European integration itself: An impressive success in figures, which nevertheless raises questions. The real challenge in the coming years will be whether Europe can use its capital market as a springboard for innovation and economic dynamism – or whether it will become a symbol of a region that has had its best years.
The history of the euro investment grade market is therefore more than just a success story of Europe as a financial center. It is a reflection of European strengths and weaknesses: Impressive stability and resilience, coupled with a certain reluctance to take the big leap. The next 25 years will show whether Europe can find its way between tradition and transformation.
Risks
Price losses due to increases in yields and/or higher risk premiums are possible. A total loss cannot be ruled out either.
Past performance is not an indication of future results, nor can future performance be guaranteed.
Disclaimer
This marketing communication within the meaning of the German Securities Trading Act (Wertpapierhandelsgesetz) is provided for information purposes only and should not be construed as personal investment advice or a recommendation or solicitation to buy, sell or hold any financial instrument or to adopt any investment strategy. The opinions and statements contained in this document reflect the current assessment on the date of publication. Thisinformation does not constitute a complete analysis of all material facts relating to any country, region or market. This is not to be considered as financial analysis.
If statements are made about market developments, returns, price gains or other asset growth as well as risk ratios, these merely constitute forecasts for whose occurrence we assume no liability. Past performance, simulations or forecasts in particular are not a reliable indicator of future performance. Assets can go up as well as down. All information has been carefully compiled; partly with recourse to information from third parties. Individual details may prove to be no longer or no longer fully accurate, in particular as a result of the passage of time, changes in the law, current developments on the markets, possibly at short notice, and may change at any time without prior notice. Therefore, no guarantee is given that all the information is correct, complete and up to date. Please inform yourself independently about all costs relevant to you. Maintaining a custody account may incur costs; ongoing bank charges may also be incurred. Transaction costs depend on the asset class: For government bonds and collateralised bonds such as mortgage bonds, they average around 0.02 percent, for corporate bonds 0.085 percent. For less liquid bonds, the transaction costs can also be significantly higher than 0.25 per cent. It should also be noted that transaction costs can temporarily be significantly higher during periods of market
stress. For all products sold by HAGIM, all relevant cost information is made available prior to purchase.
The information is based on our assessment of the current legal and tax situation. If tax or legal matters are affected, these should be discussed by the addressee with their tax advisor or lawyer. Investments in financial instruments are associated with both opportunities and risks. The handling of conflicts of interest at HAGIM is published online in the legal notice on https://www.ha-gim.com/en/legal-information. The information contained in this document is intended for professional clients and eligible counterparties only. This information document is not directed at US citizens or permanent residents, nor to legal entities domiciled in the USA, nor may it be distributed in the US.
