


Authors


The European high-yield market has undergone a fundamental transformation over the past 15 years: what was once a procyclical yield niche has evolved into a mature, diversified institutional asset class. This white paper outlines 10 reasons why high yield is now a compelling choice not only as a tactical tool but also as a core strategic investment, and how it improves the risk-return profile of your overall fixed-income allocation.
Our 10 Reasons at a Glance
1. From a Niche Market to an Institutional Asset Class
2. Structural Improvements in the EUR High-Yield Market
3. Lower Interest Rate Risk Than Investment-Grade and Government Bonds
4. High Yield Buffers as a Protective Factor
5. Time in the Market Beats Timing
6. Yield levels as a basis for medium-term returns
7. Actual loss rates lower than feared
8. Sharp price declines, but with a quick recovery
9. High-yield bonds as a portfolio diversifier
10. Targeted allocation improves the risk-return profile
Anyone who views high-yield bonds merely as a supplement is underestimating the quality of this asset class.
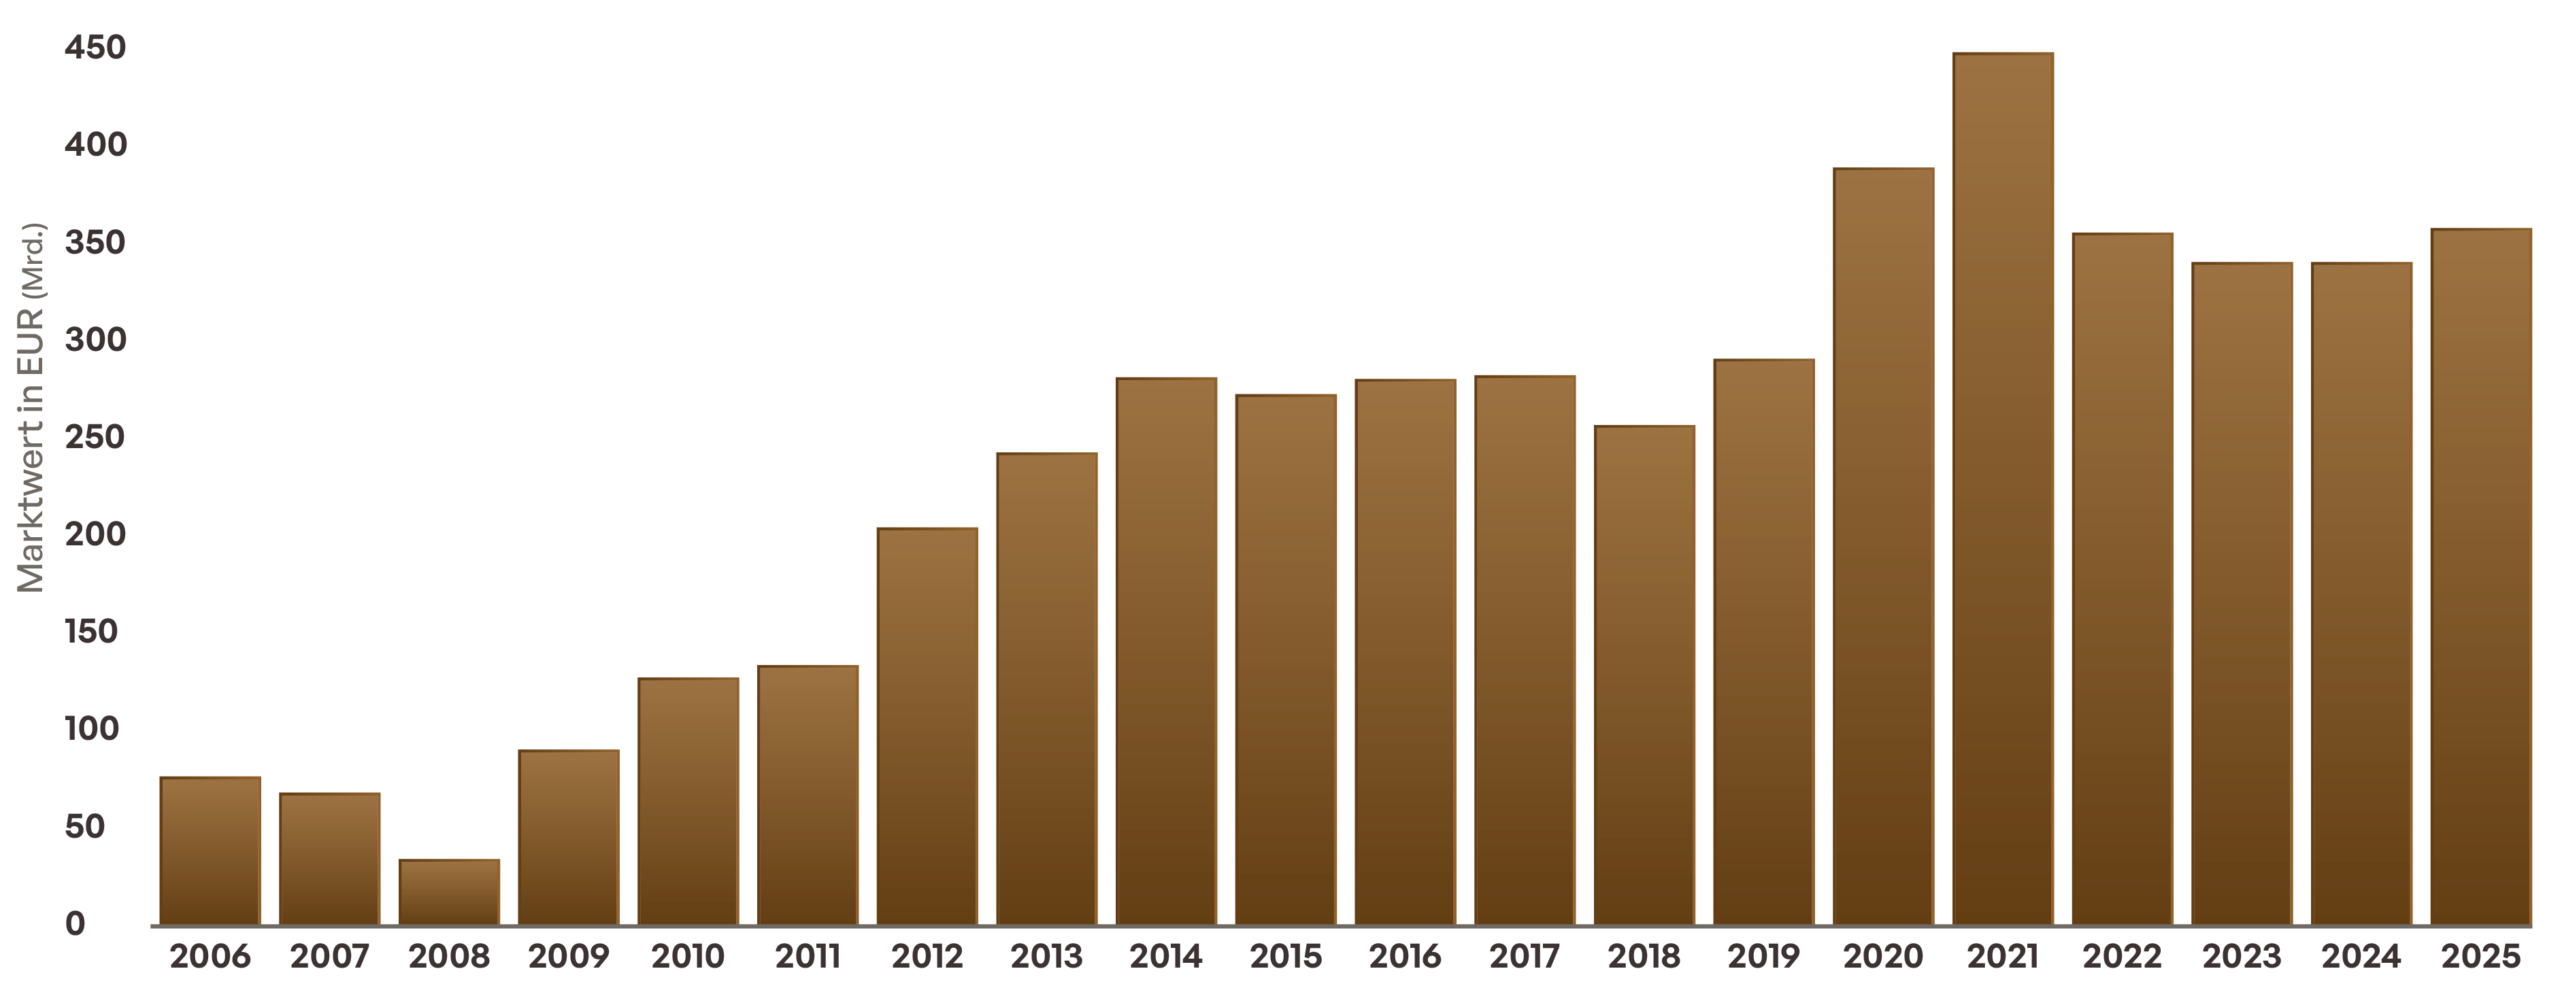
The EUR high-yield market has undergone a fundamental transformation over the past two decades. In 2006, the market volume stood at around 75 billion EUR; today, it exceeds 350 billion EUR. This is not gradual growth. It is a different market.
350 billion euros means: sufficient depth for institutional investors, genuine diversification across issuers and sectors, and liquidity that supports strategic allocation—not just tactical allocation.
Source: Bloomberg, Bloomberg Euro High Yield ex Financials BB-B 3% Capped Total Return Index; as of December 31, 2025
It’s not just the size that has changed, but above all the quality.
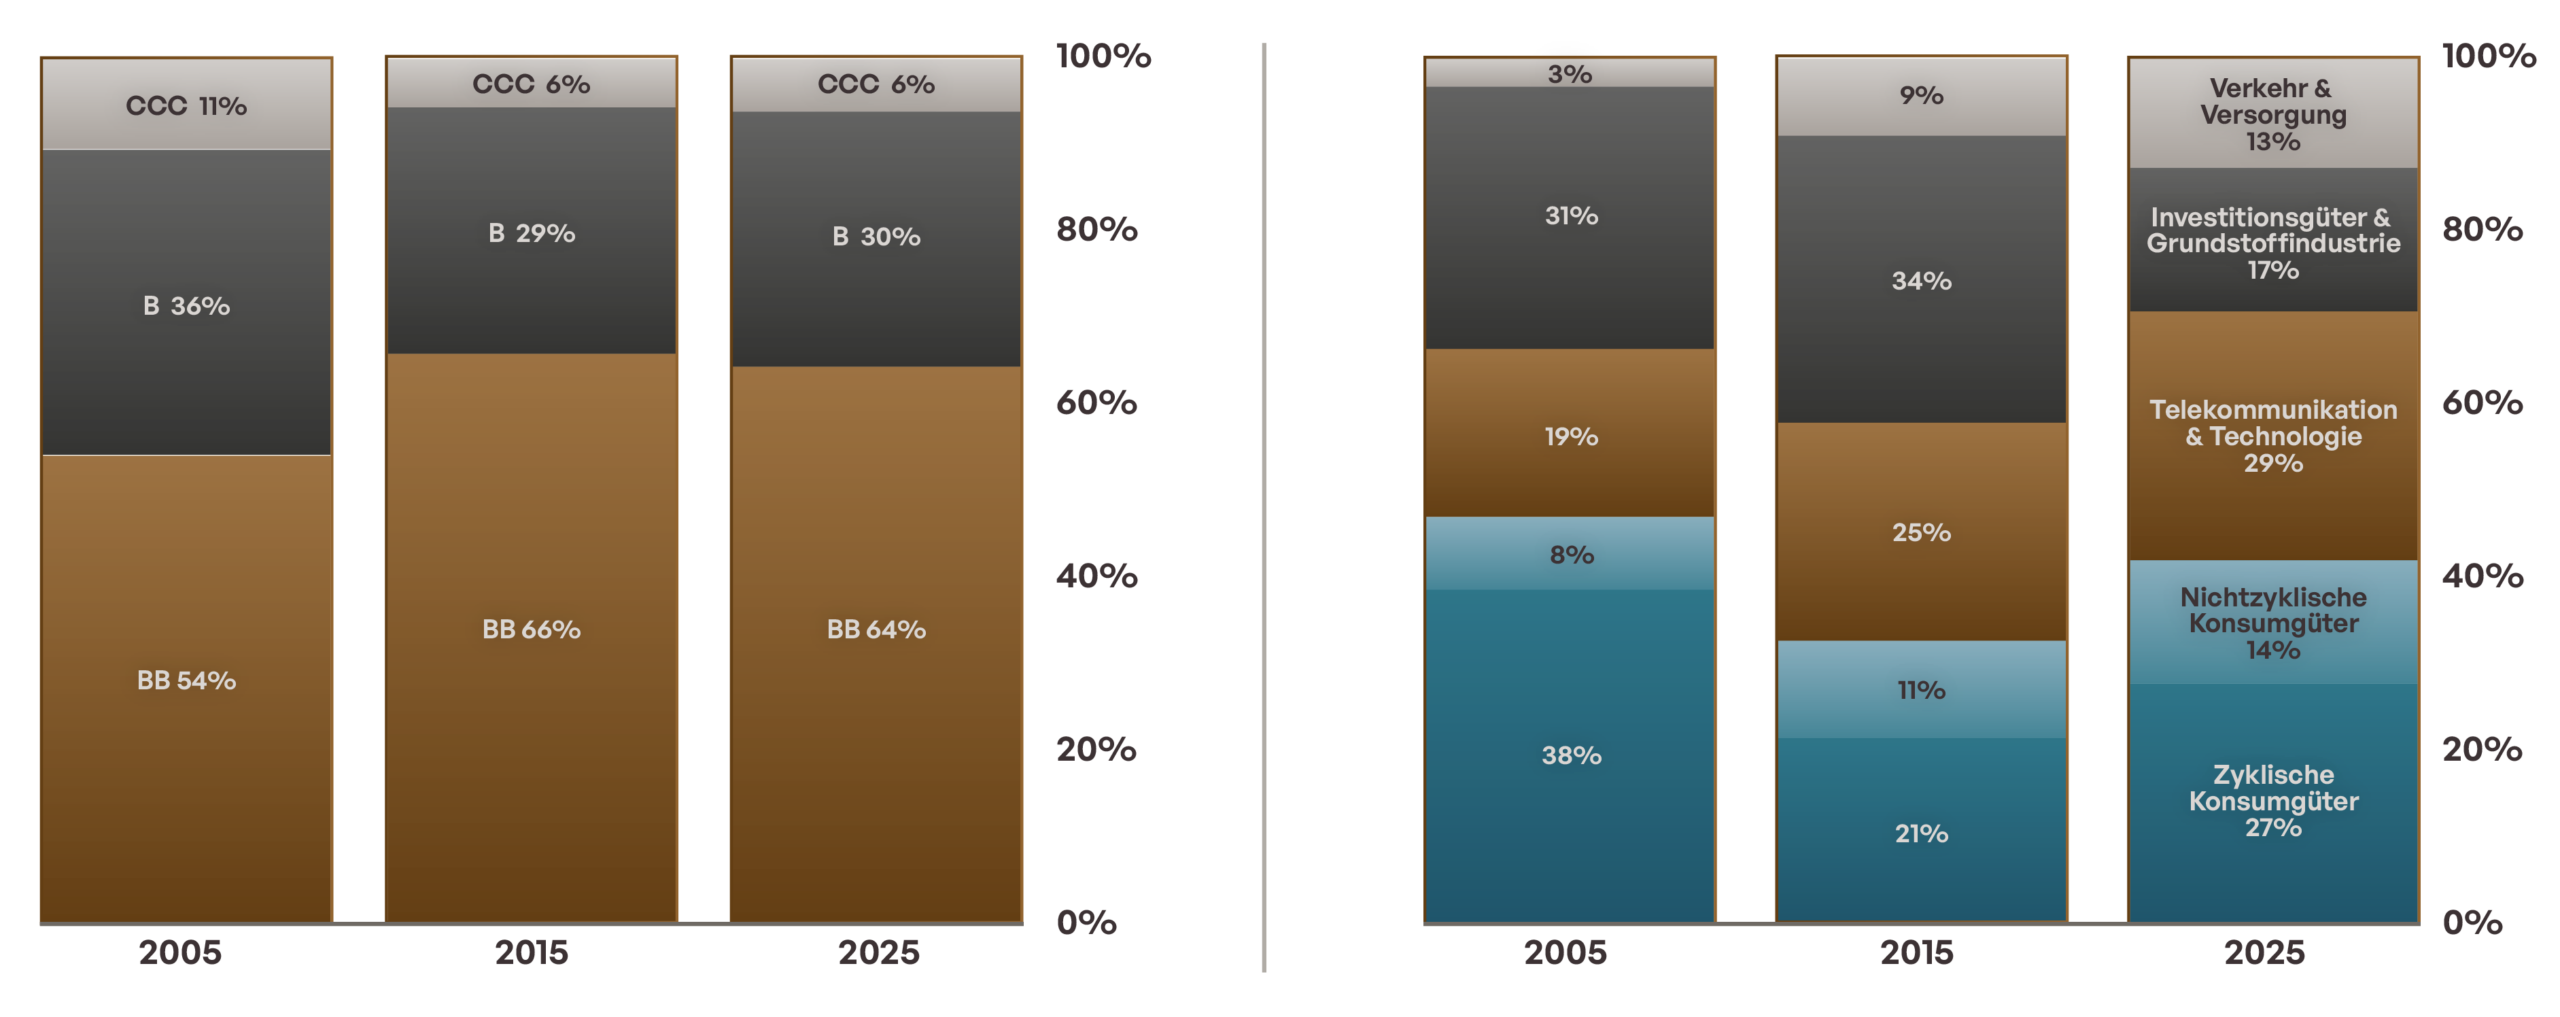
Two trends have shaped the last two decades: Credit quality has improved structurally. BB-rated issuers now account for about 64% of the market, up from 54% in 2005. The CCC segment has shrunk from 11% to 6%. This is significant because, historically, the BB segment has had the lowest loss rates of all sub-investment-grade segments. The market has improved in quality.
The sector allocation has become significantly more balanced. Two decades ago, a few sectors dominated the universe; today, the market is more broadly distributed across telecommunications, technology, consumer goods, industrials, and utilities. Less concentration risk, more genuine diversification within the asset class.
Rating Distribution of the EUR Universe (left) & Sectoral Distribution of the EUR Universe (right)
Development Over Two Decades
Source for Figure 1: Own calculations, Bloomberg, Bloomberg High Yield EUR Quality BB, B, and CCC; Period: 2005 to 2025
Source for Figure 2: Own calculations (B-class Level 3) excluding financials, Bloomberg, Bloomberg High Yield EUR; Period: 2005 to 2025
One characteristic that clearly distinguishes the EUR high-yield market from other bond markets is its low sensitivity to interest rates.
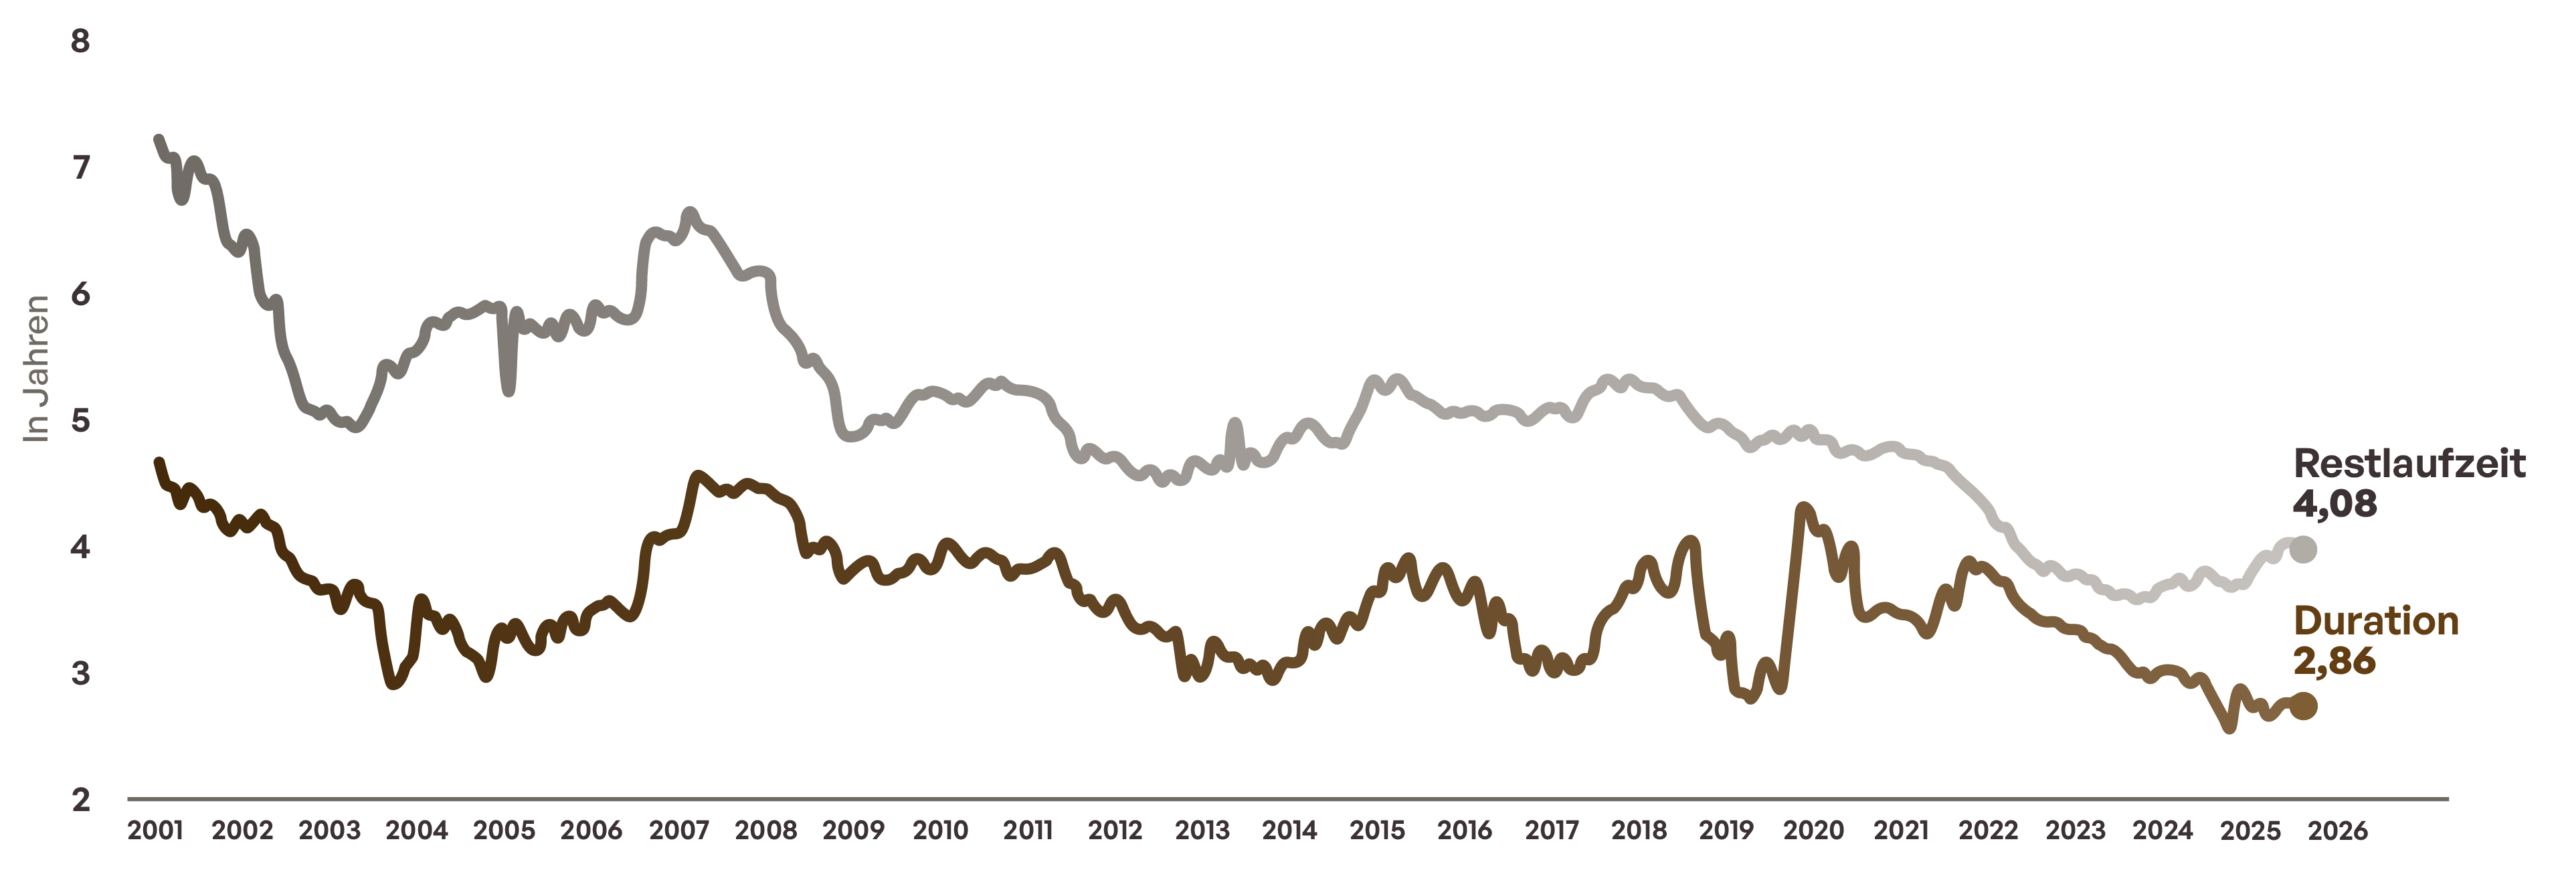
The duration is currently just under 3 years. This is a historic low and significantly below the investment-grade average of about 5 years. A rise in interest rates would therefore have a much smaller impact on a high-yield portfolio than on a traditional investment-grade or government bond portfolio.
Just how relevant this is became clear in 2022: In the year with the sharpest rise in interest rates in decades, the euro high-yield market lost significantly less than investment-grade bonds and government bonds. Not despite, but because of its structure—shorter maturities, faster capital turnover, and lower interest-rate sensitivity.
For investors, this means that high-yield bonds not only provide current income but can also reduce interest rate risk in a fixed-income portfolio. This is a characteristic that is regularly overlooked in the SAA discussion.
Source: Bloomberg, Bloomberg Euro High Yield ex Financials BB-B 3% Capped Total Return Index; as of December 31, 2025
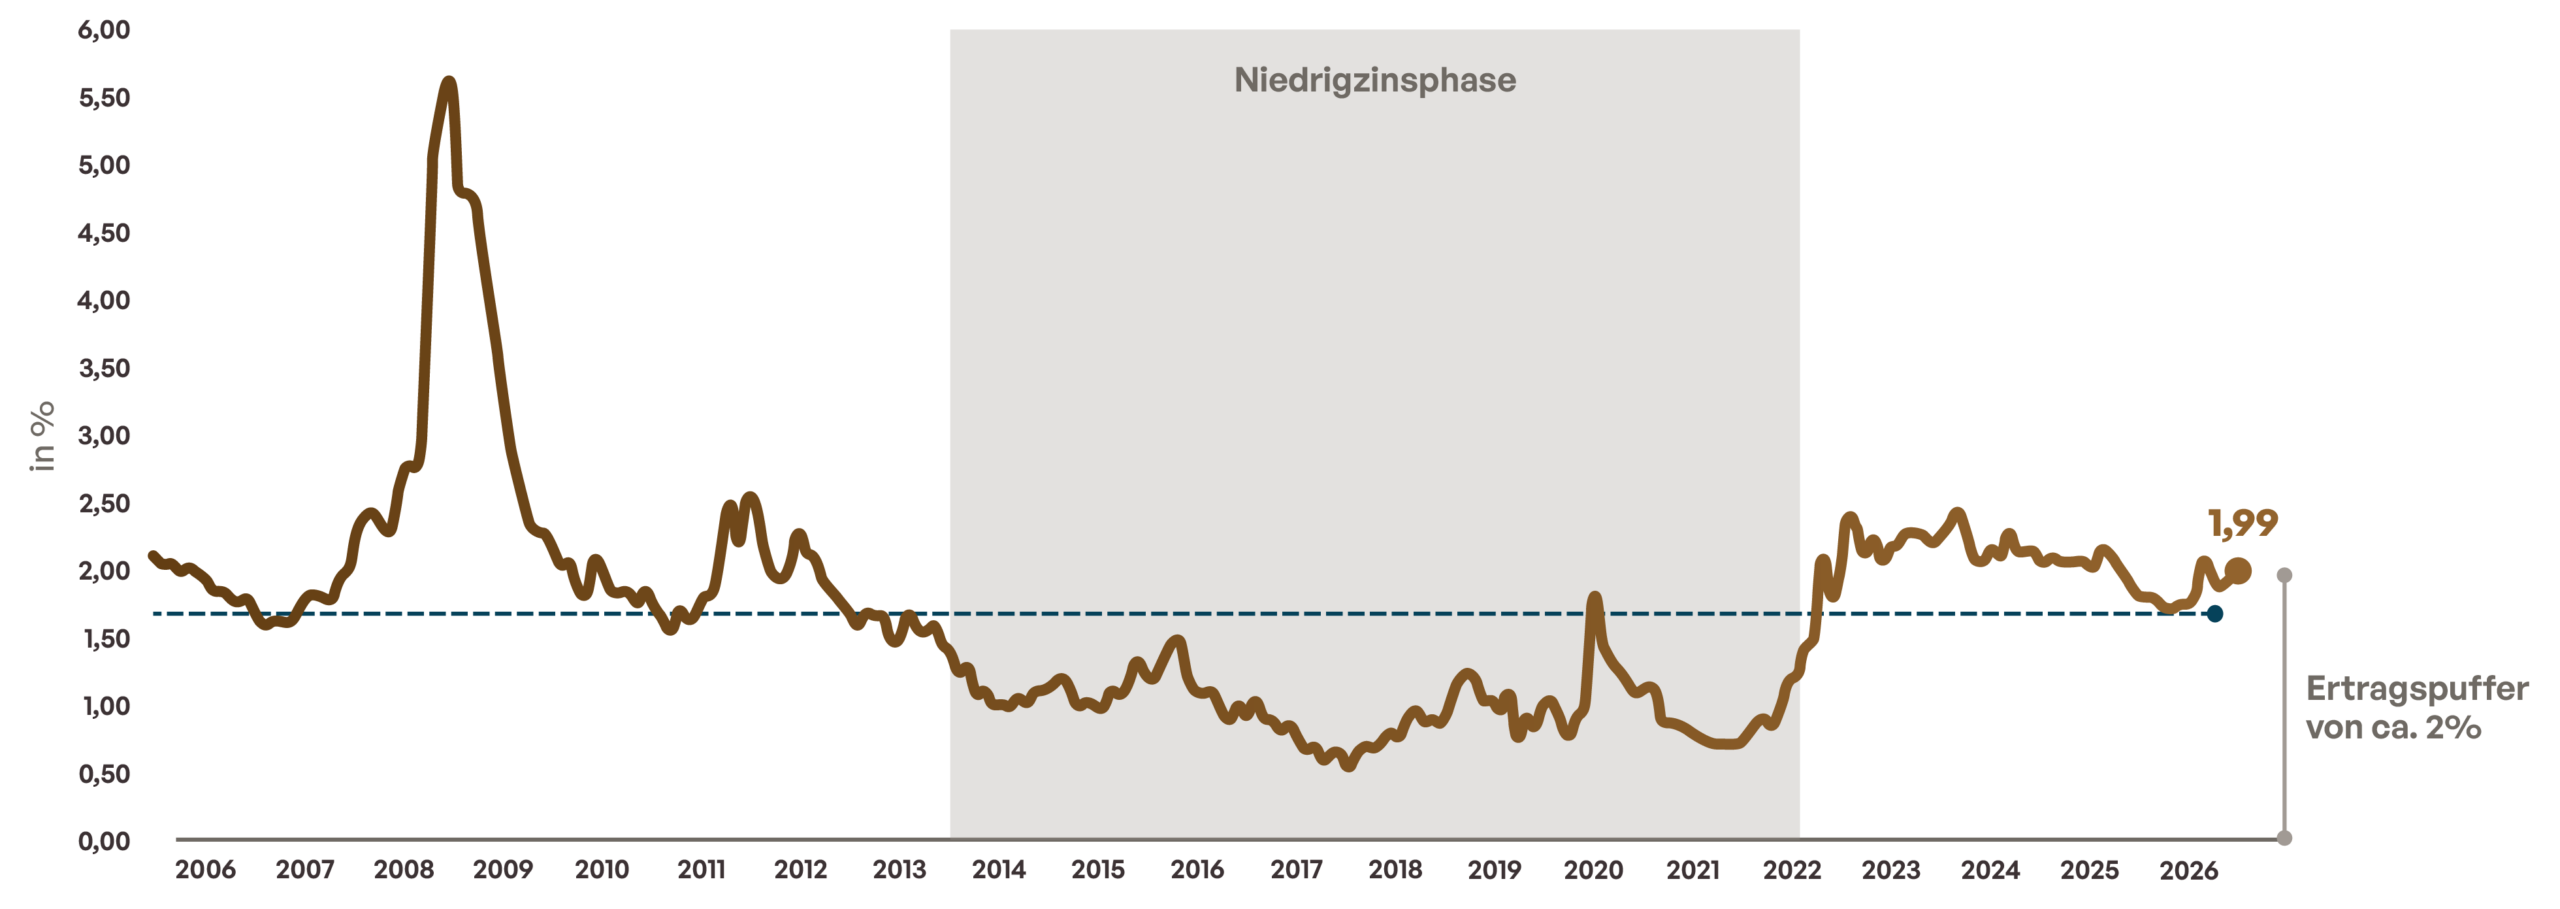
There is another advantage that is certainly interesting and relevant to investors. The current income provides protection before actual capital losses occur on high-yield bonds.
The current break-even yield provides a substantial buffer before price declines erode interest income. Even with moderate spread widening, the total return often remains positive thanks to this strong “carry.” This is a strong argument for using high-yield bonds strategically rather than merely tactically.
Source: Own calculations; Bloomberg, Bloomberg High Yield (Euro) ex Fin TR Index Unhedged EUR; as of July 31, 2026; The break-even yield determines the increase in yield at which current income and price effects balance each other out over a 12-month period.
Volatility and loss are not the same thing. Whether a price fluctuation in the euro high-yield market results in a realized loss depends primarily on one factor: the holding period.
Since 2002, the range has spanned over a year, from -29.9% to +49.5%. For holding periods of six years or longer, the weakest result across all rolling periods was positive.
The reason is structural: price losses resulting from widening spreads are temporary and expire on the maturity date. The coupon is paid annually. As the holding period increases, the carry effect becomes dominant; the remaining risk is credit risk, not timing risk.
For investors with a long-term investment horizon, this means that the key question is not when to enter the market, but whether to stick with it.
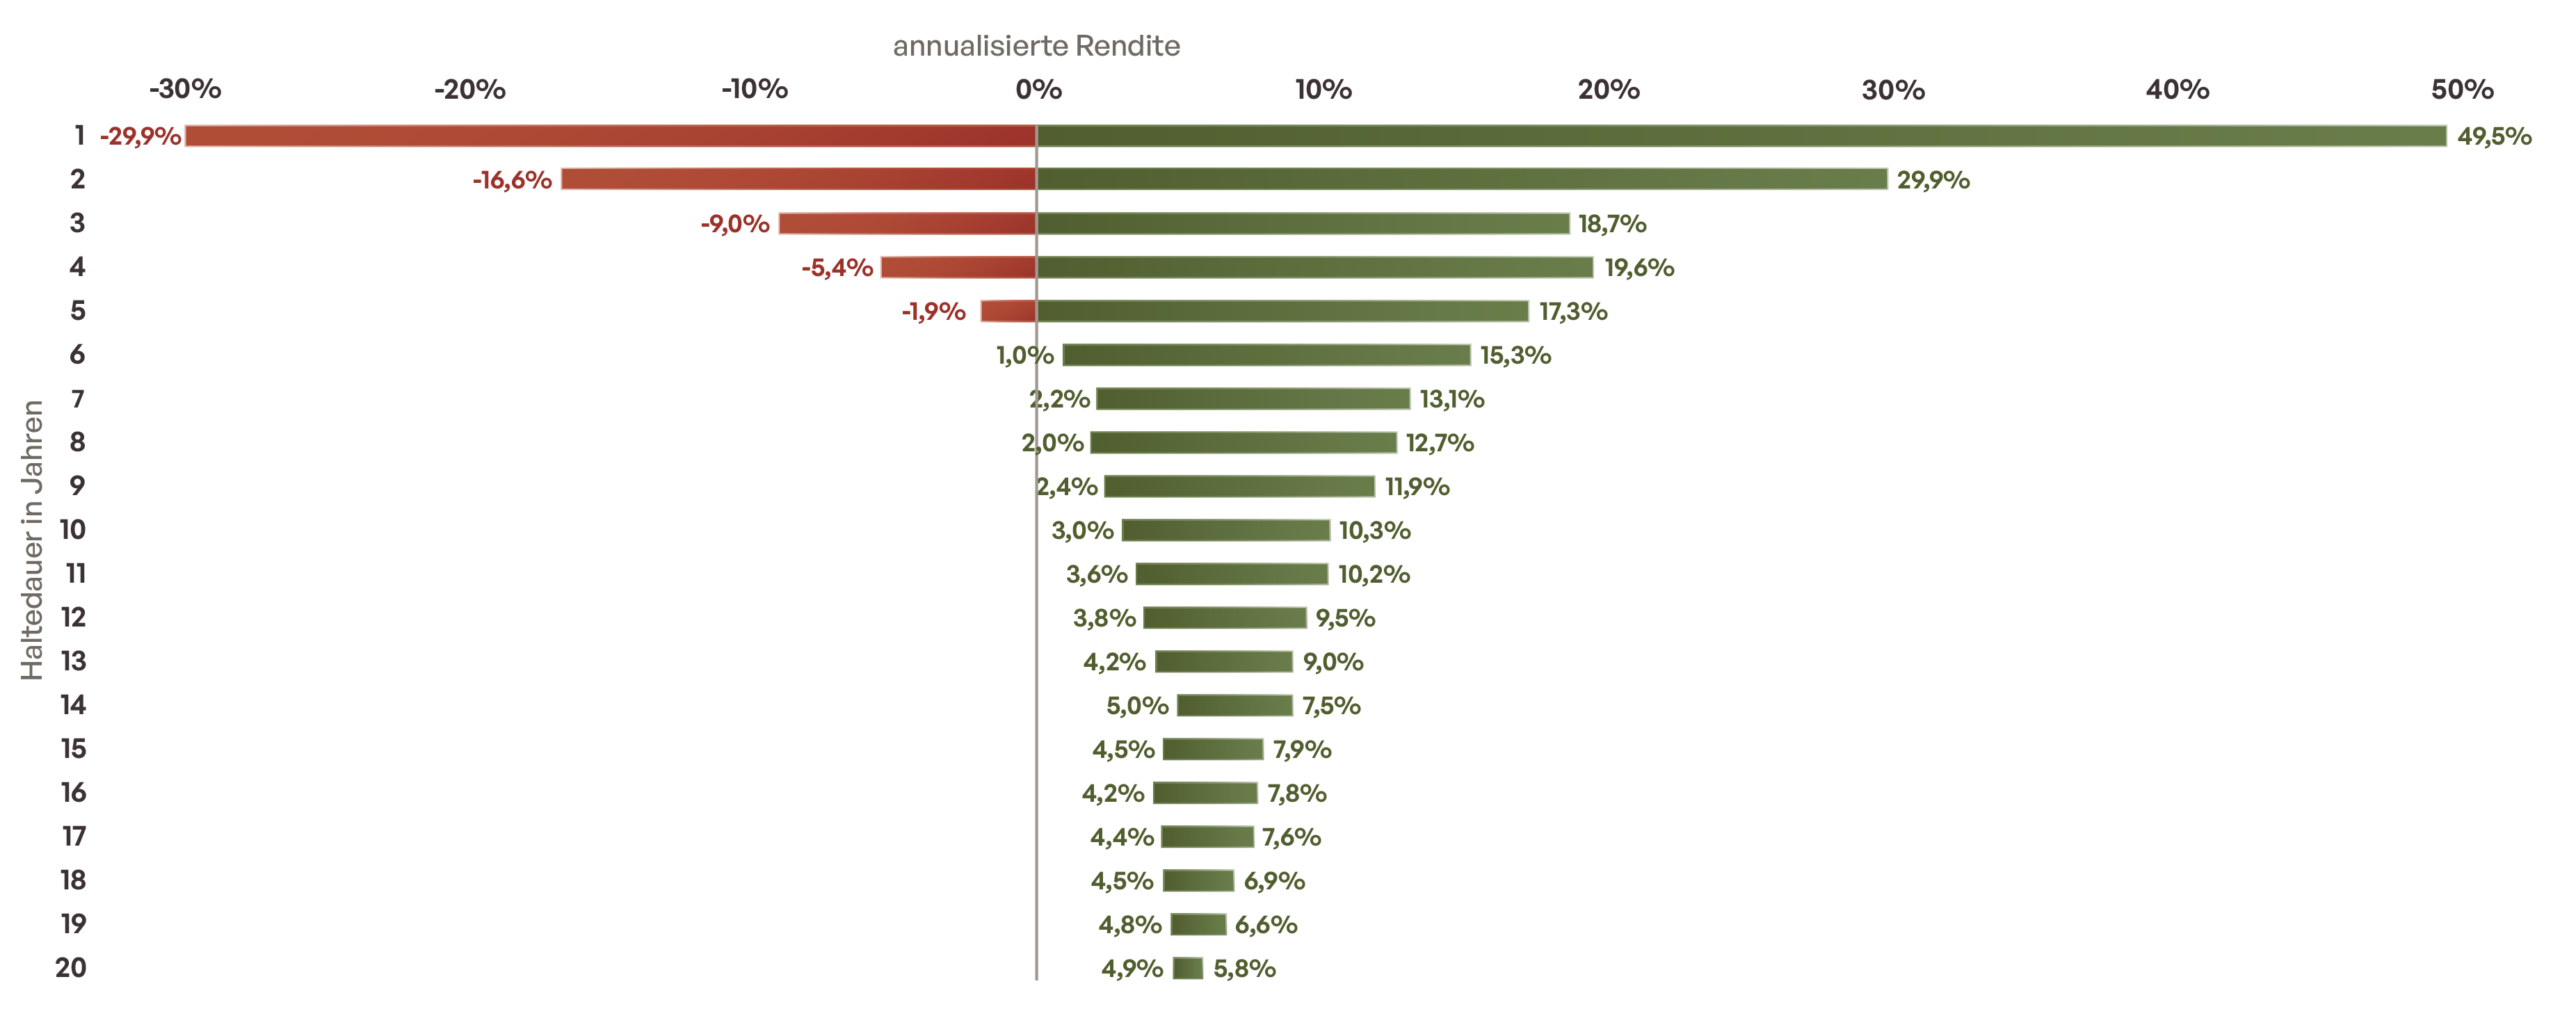
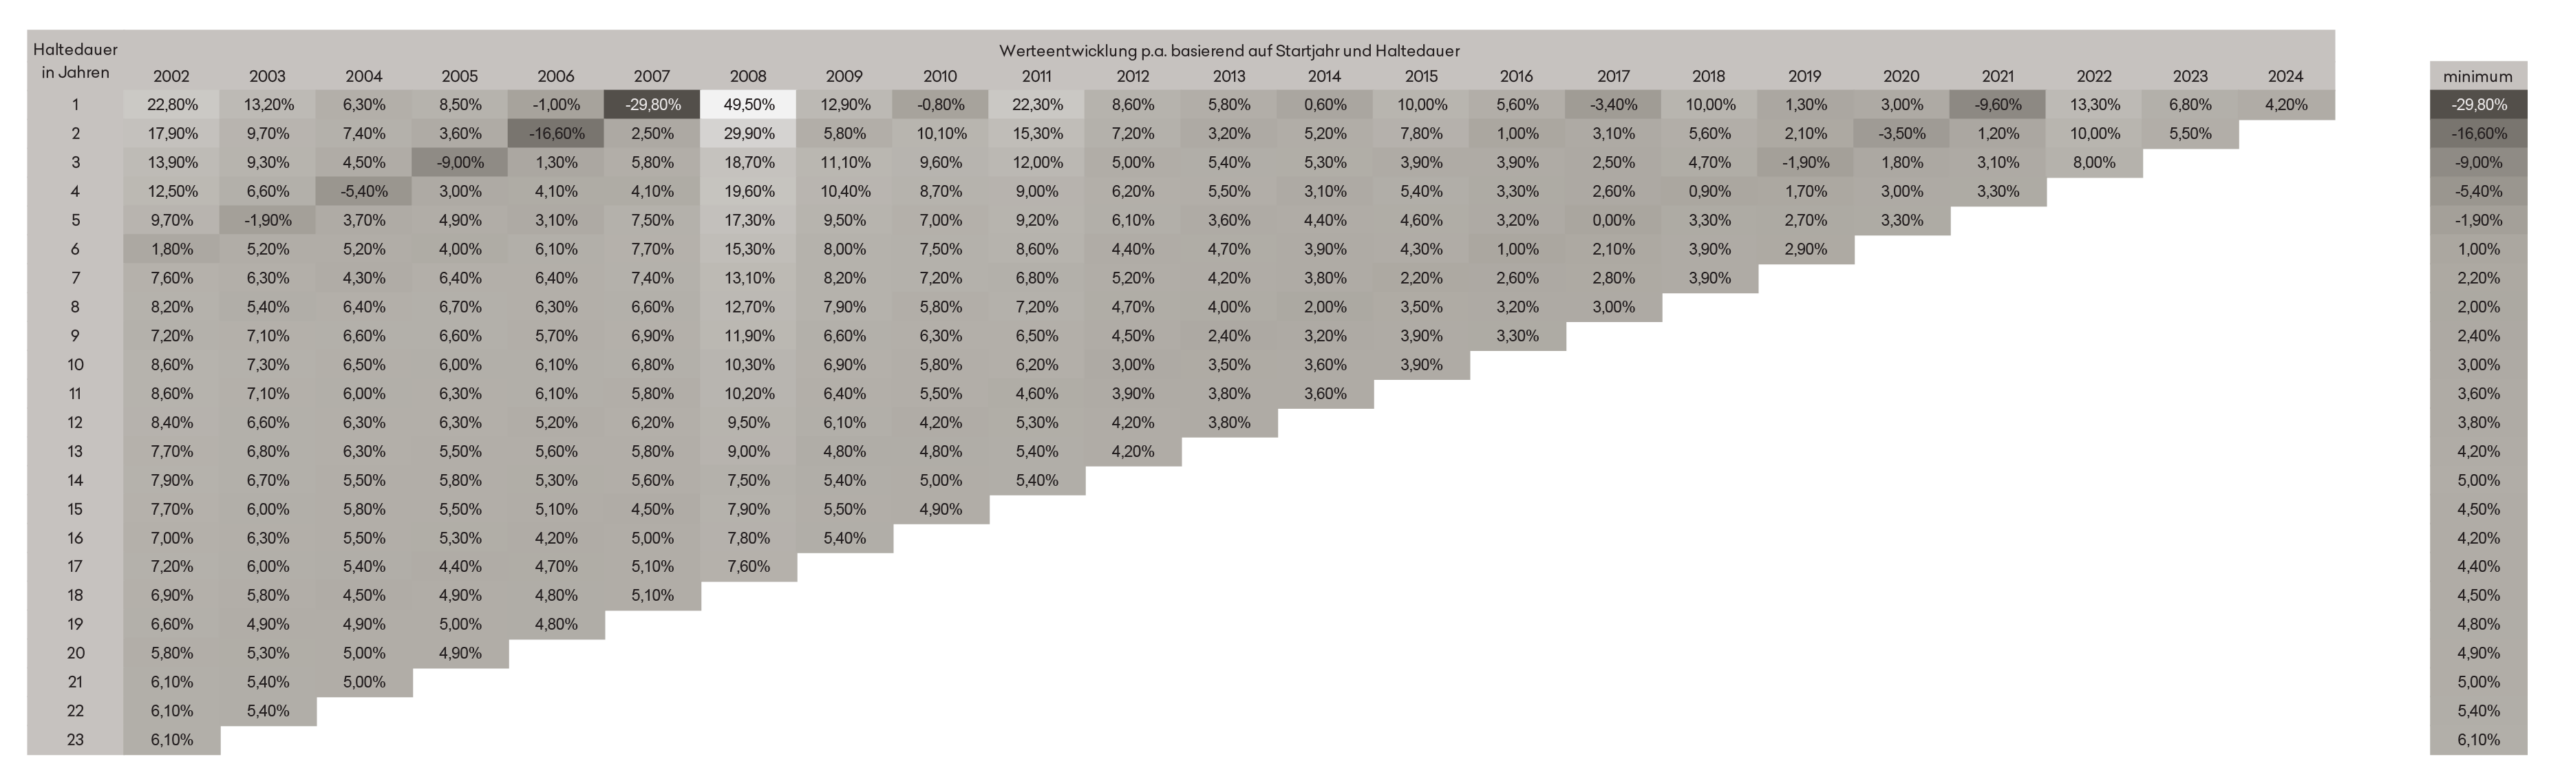
Source: Bloomberg, Bloomberg Euro High Yield ex Financials BB-B 3% Capped Total Return Index (H23969EU Index); Annualized performance of the index across various start years (beginning of each year) and holding period combinations; as of December 31, 2025
Timing isn’t everything. There is also another indicator—the yield to maturity—that is generally a reliable predictor of future returns in the high-yield sector.
Historically, we have observed a very strong positive correlation between the initial yield and the actual returns achieved over the following years. Current yield levels therefore provide an excellent and predictable starting point for medium-term returns.
Return on Investment and Realized Performance
Star returns show a positive correlation with performance
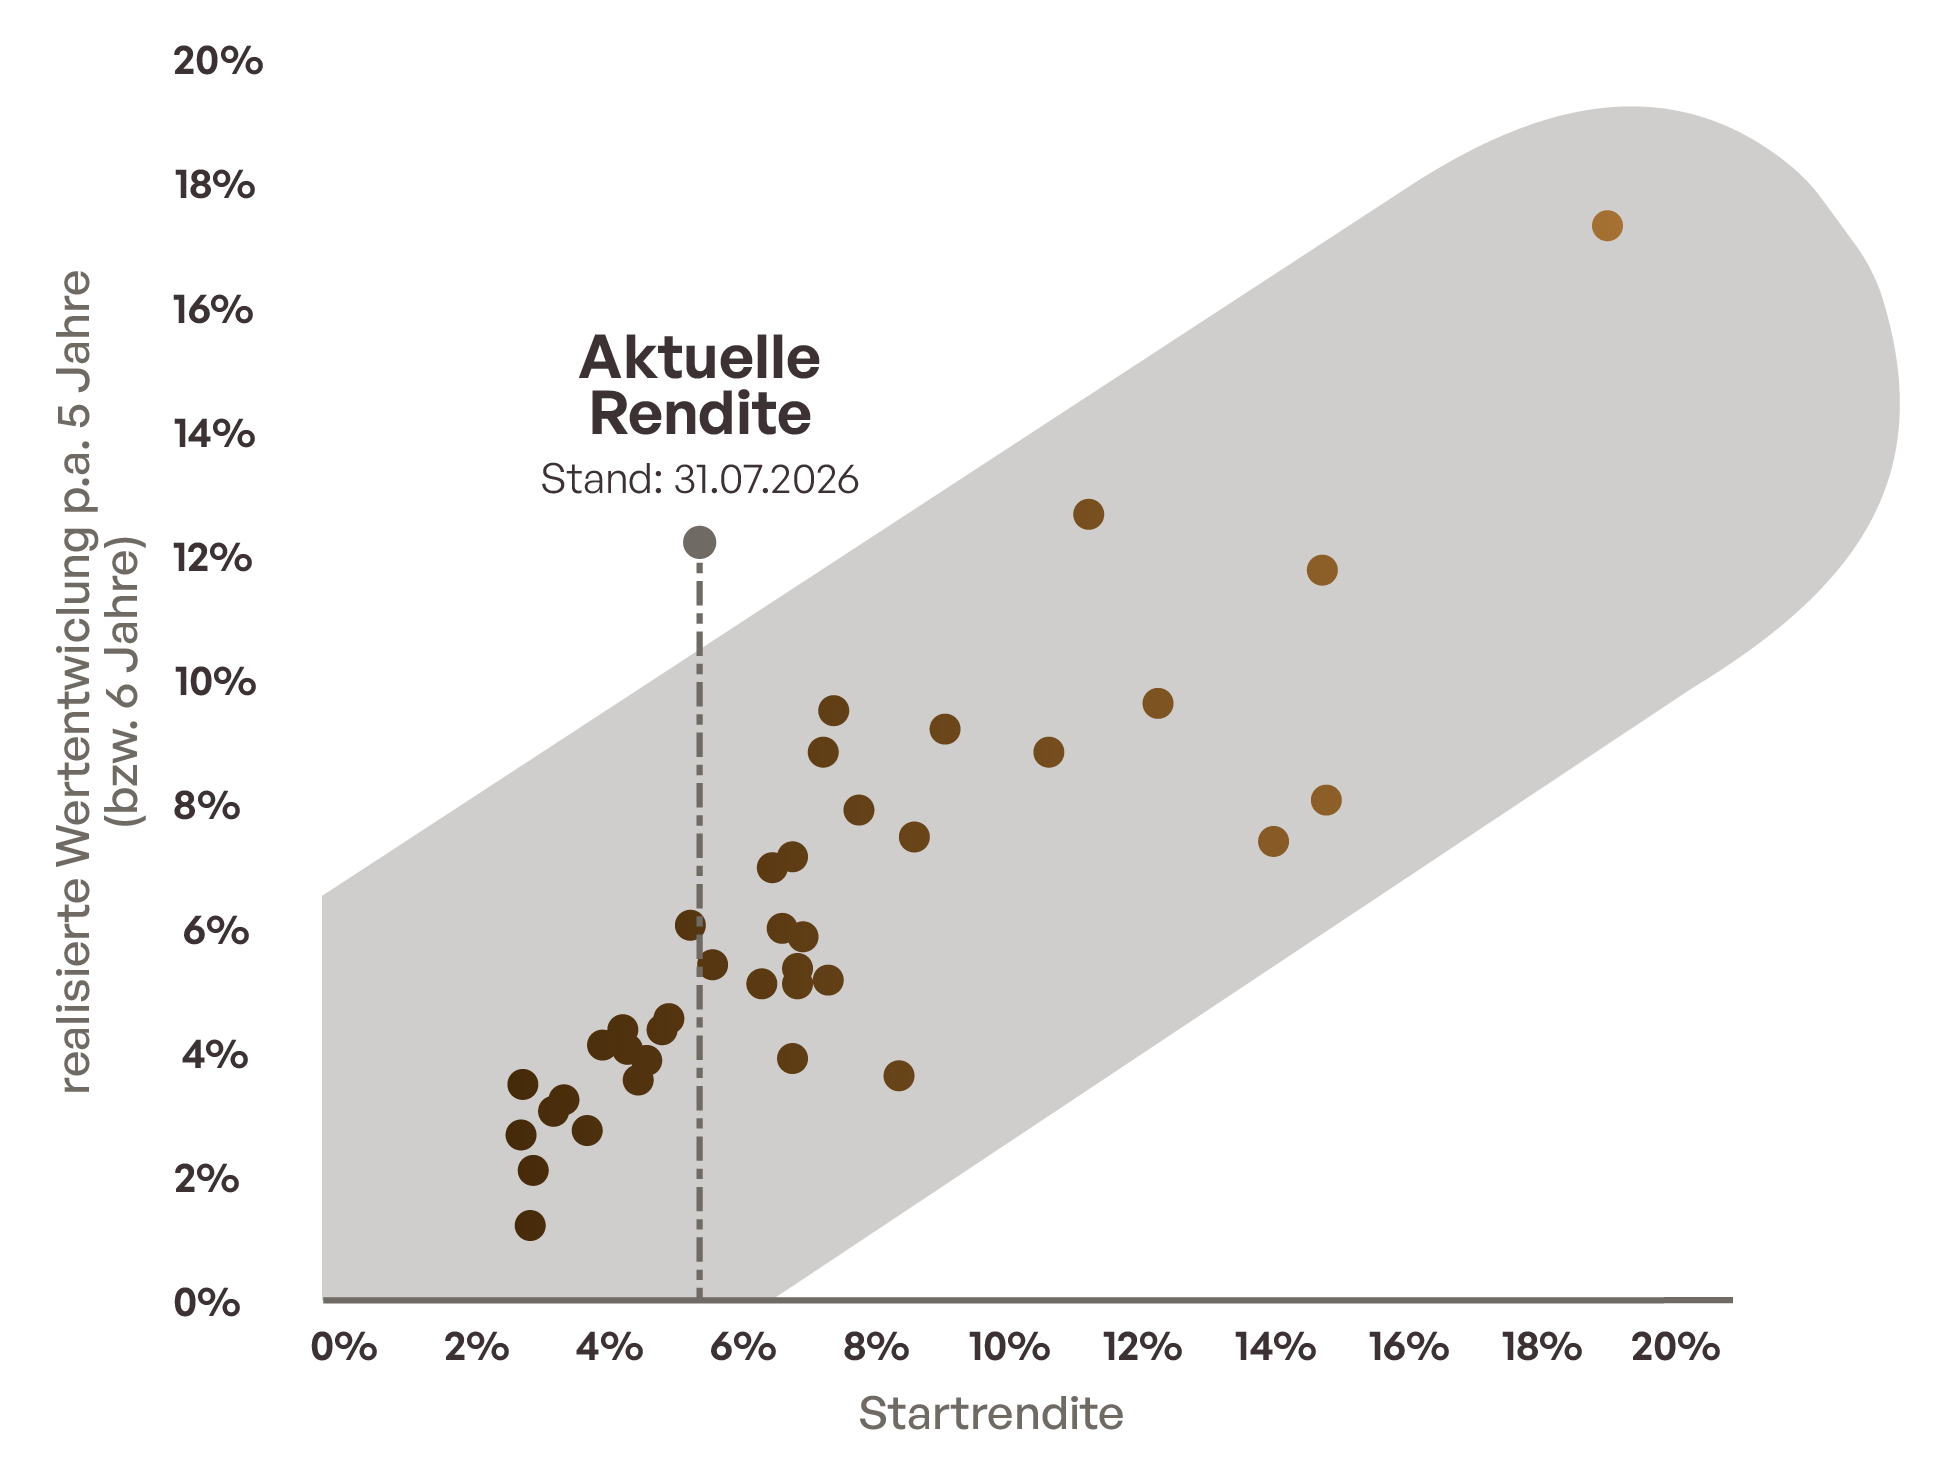
Source: Bloomberg, our own calculations; Bloomberg Euro High Yield ex Financials BB-B 3% Capped Total Return Index; last period: December 31, 2020, through December 31, 2025
Many investors still associate high-yield bonds primarily with high default risks. However, the experience of the past four decades paints a more nuanced picture. What matters is not just how many issuers default, but what loss the investor actually incurs after liquidation. Over the past two decades, this loss has been structurally lower than in previous cycles.
At the same time, the spreads earned were, on a long-term average, significantly higher than the actual credit losses across all rating categories. Thus, defaults eroded only a comparatively small portion of the risk premium; the larger portion remained with the investor as additional return.
High-yield bonds are therefore less speculative than their name might suggest. Over a full cycle, this asset class offers robust and relatively predictable return potential.
Annual Loan Default Rate by Rating
From 1986 to 2025
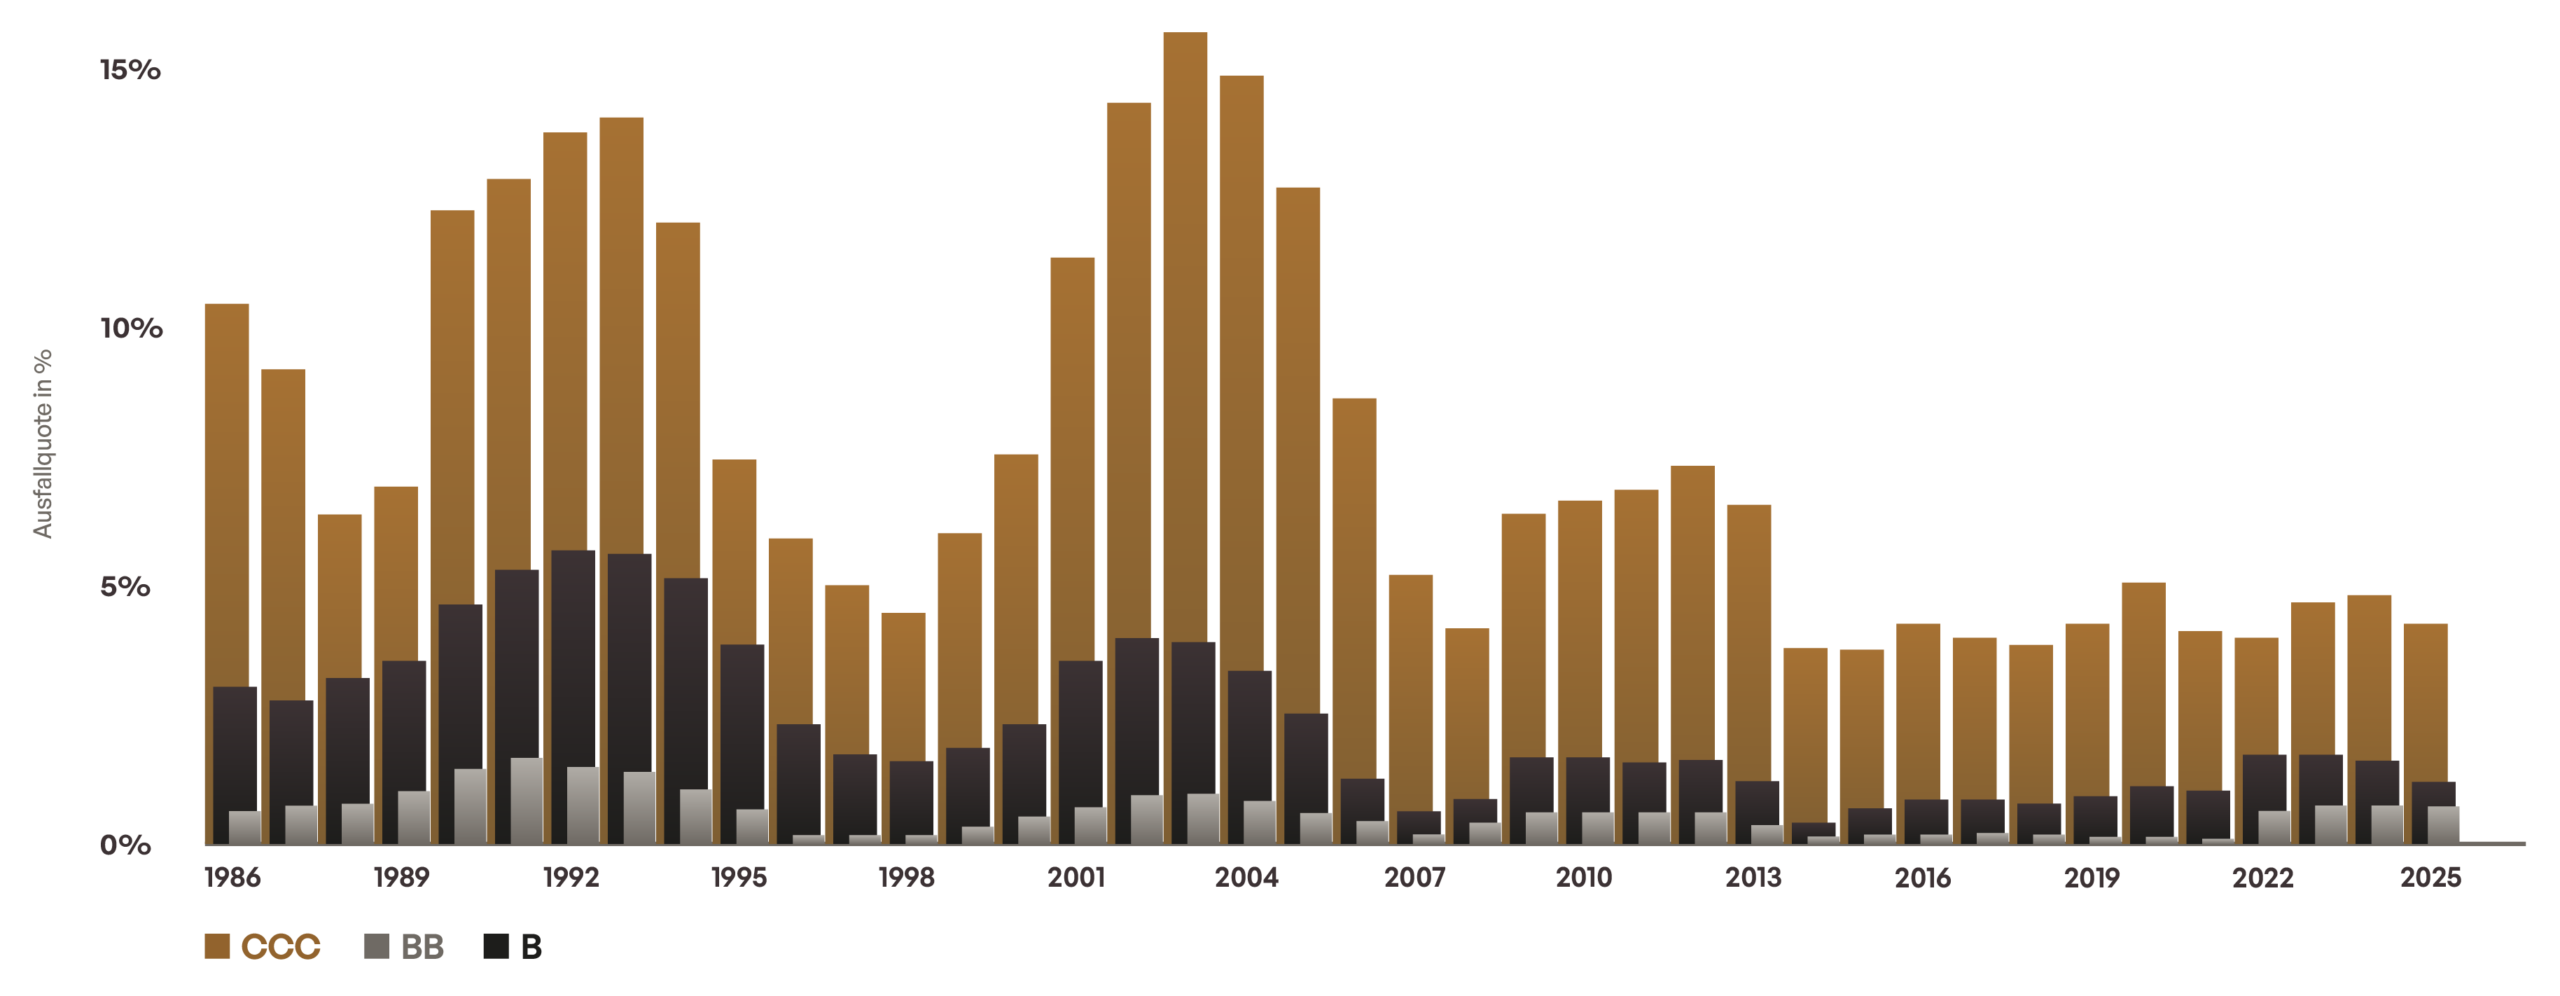
Source: Moody’s Annual Default Study, February 2025; the credit default rate is the annual loss borne by investors, calculated as the combination of the default rate and the recovery rate
Drawdowns are a normal part of the euro high-yield market. However, a look back at the past 25 years shows that sharp declines have repeatedly been followed by strong recoveries.
This makes tactical exits challenging. Anyone who sells during a market downturn must make two correct decisions—when to exit and when to re-enter at the right time. Otherwise, a significant portion of the subsequent recovery may be lost.
For this reason, we do not focus on the short-term timing of the overall market. Our focus is on thorough fundamental analysis, selective issuer and bond selection, and active risk management. The goal is to navigate portfolios through volatile market phases without prematurely giving up on recovery potential.
Historical Performance of High-Yield Bonds
Higher Returns with Higher Volatility
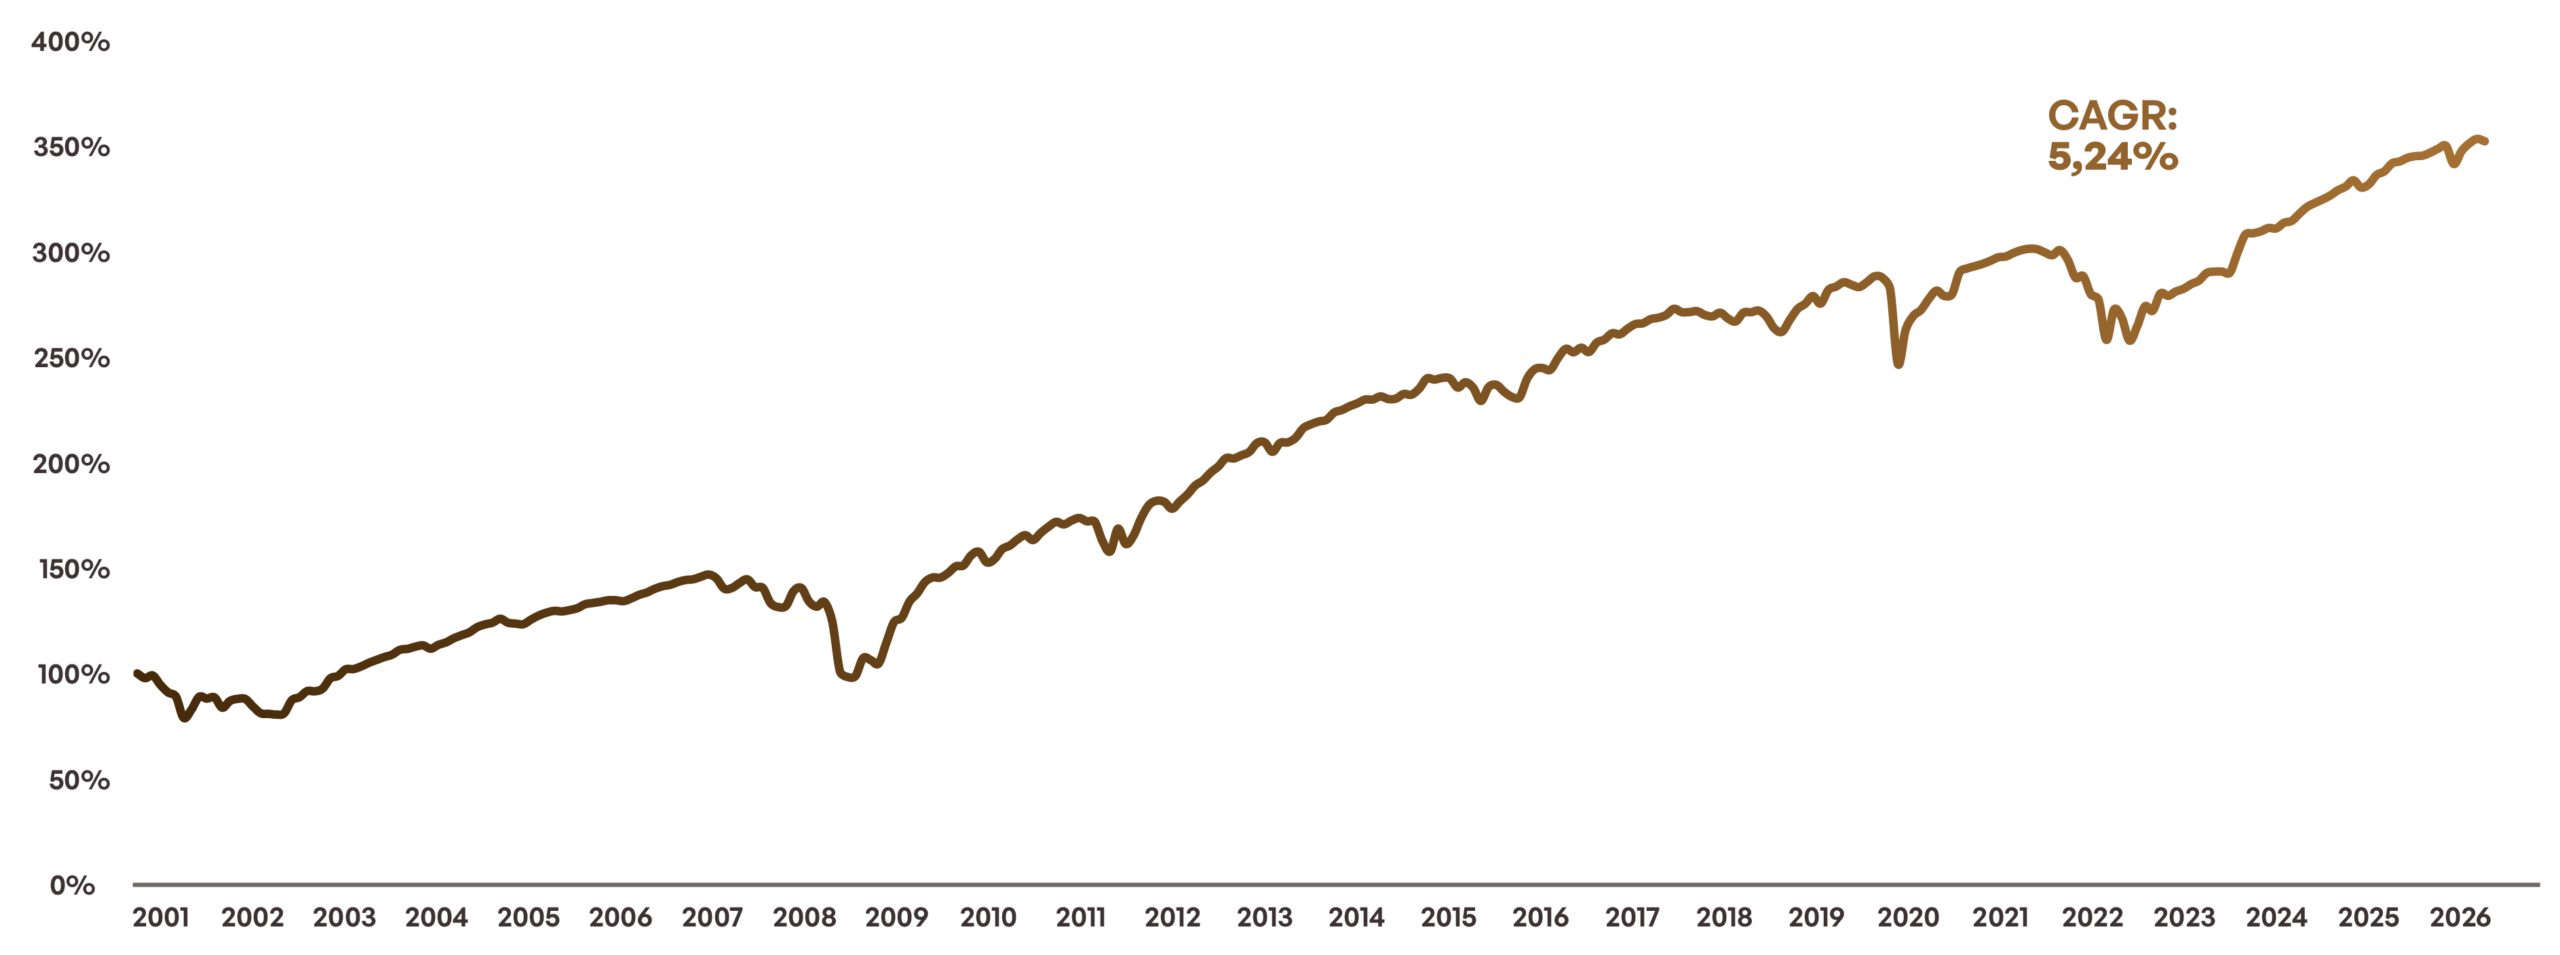
Drawdowns Since 2000
Sharp, but short drawdowns
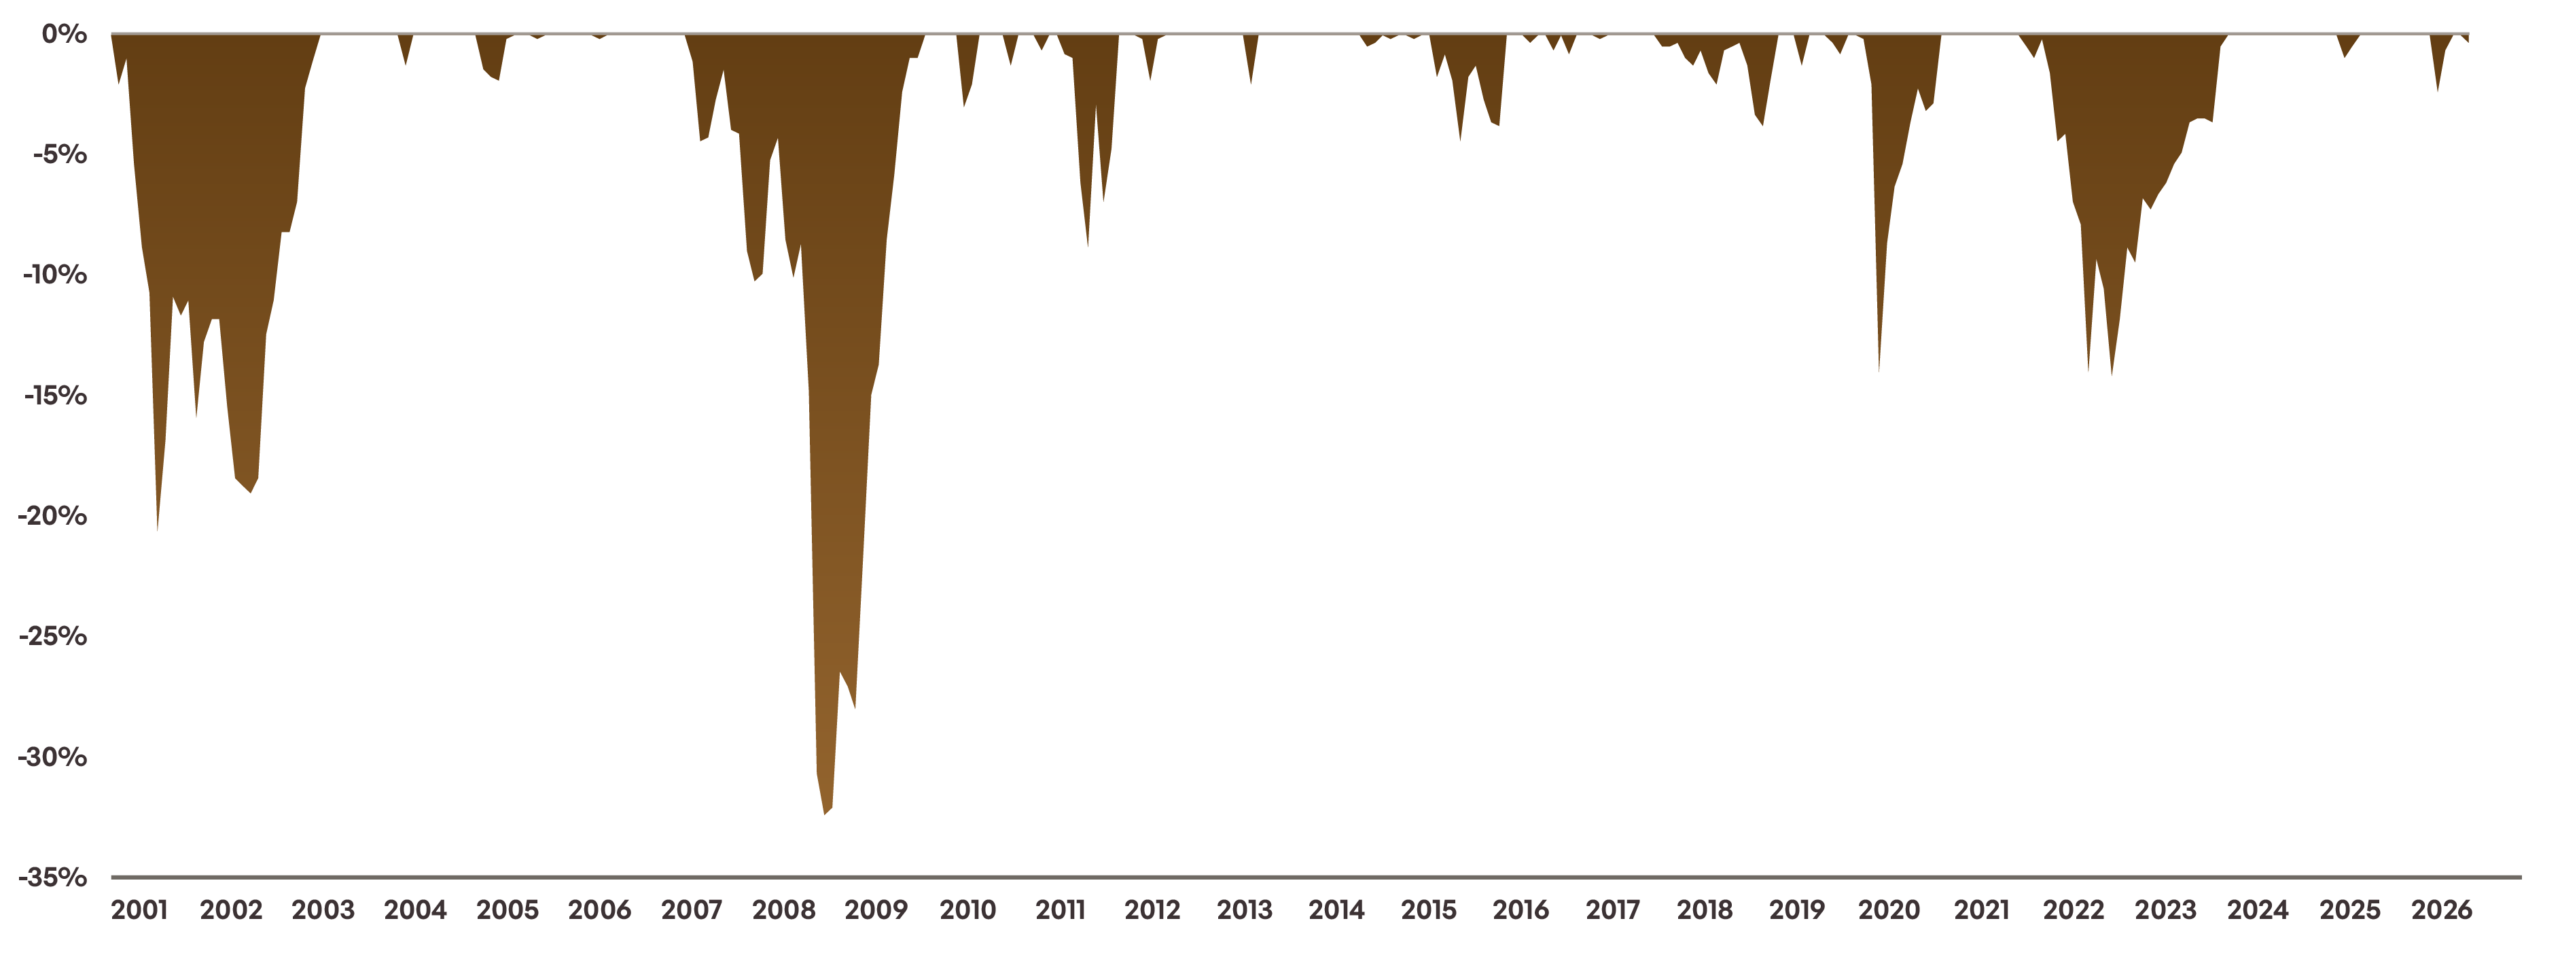
Source: Bloomberg, Bloomberg Euro HY ex Financials BB-B 3% Capped TR Index Hedged EUR; as of July 31, 2026
| Index | 7/2025– 7/2026 | 7/2024– 7/2025 | July 2023– , July 2024 | July 2022– y 2023 | July 2021– , July 2022 |
|---|---|---|---|---|---|
| Bloomberg Euro High Yield ex Financials BB-B 3% Capped Total Return Index | +3,07% | +7,50% | +9,71% | +6,37% | -9,37% |
Diversification proves its value especially when asset classes do not all react the same way to every shock.
Two periods of stress illustrate this point: During the COVID-19 shock of 2020, the market was dominated by sharply rising credit risk premiums as well as concerns about liquidity and defaults. Euro high-yield bonds posted the sharpest decline compared to euro-denominated government bonds and euro-denominated investment-grade corporate bonds, and took the longest to recover to their initial levels.
During the interest rate shock beginning in 2022, the trend reversed: Euro high-yield bonds had already returned to their initial levels by December 2023. Euro IG corporate bonds took until January 2026 to do so; Euro government bonds had not yet returned to their initial levels even by the end of the observation period in May 2026. The main factor was the structurally shorter duration of Euro High Yield.
This does not make Euro High Yield a hedge against crises. However, its differently weighted mix of credit and interest rate risks can be a useful complement to a traditional bond portfolio. Its contribution to diversification lies not in a blanket increase in crisis resilience, but in its different response to various stress triggers.
COVID-19 in 2020 (left) & Rising Interest Rates in 2022 (right)
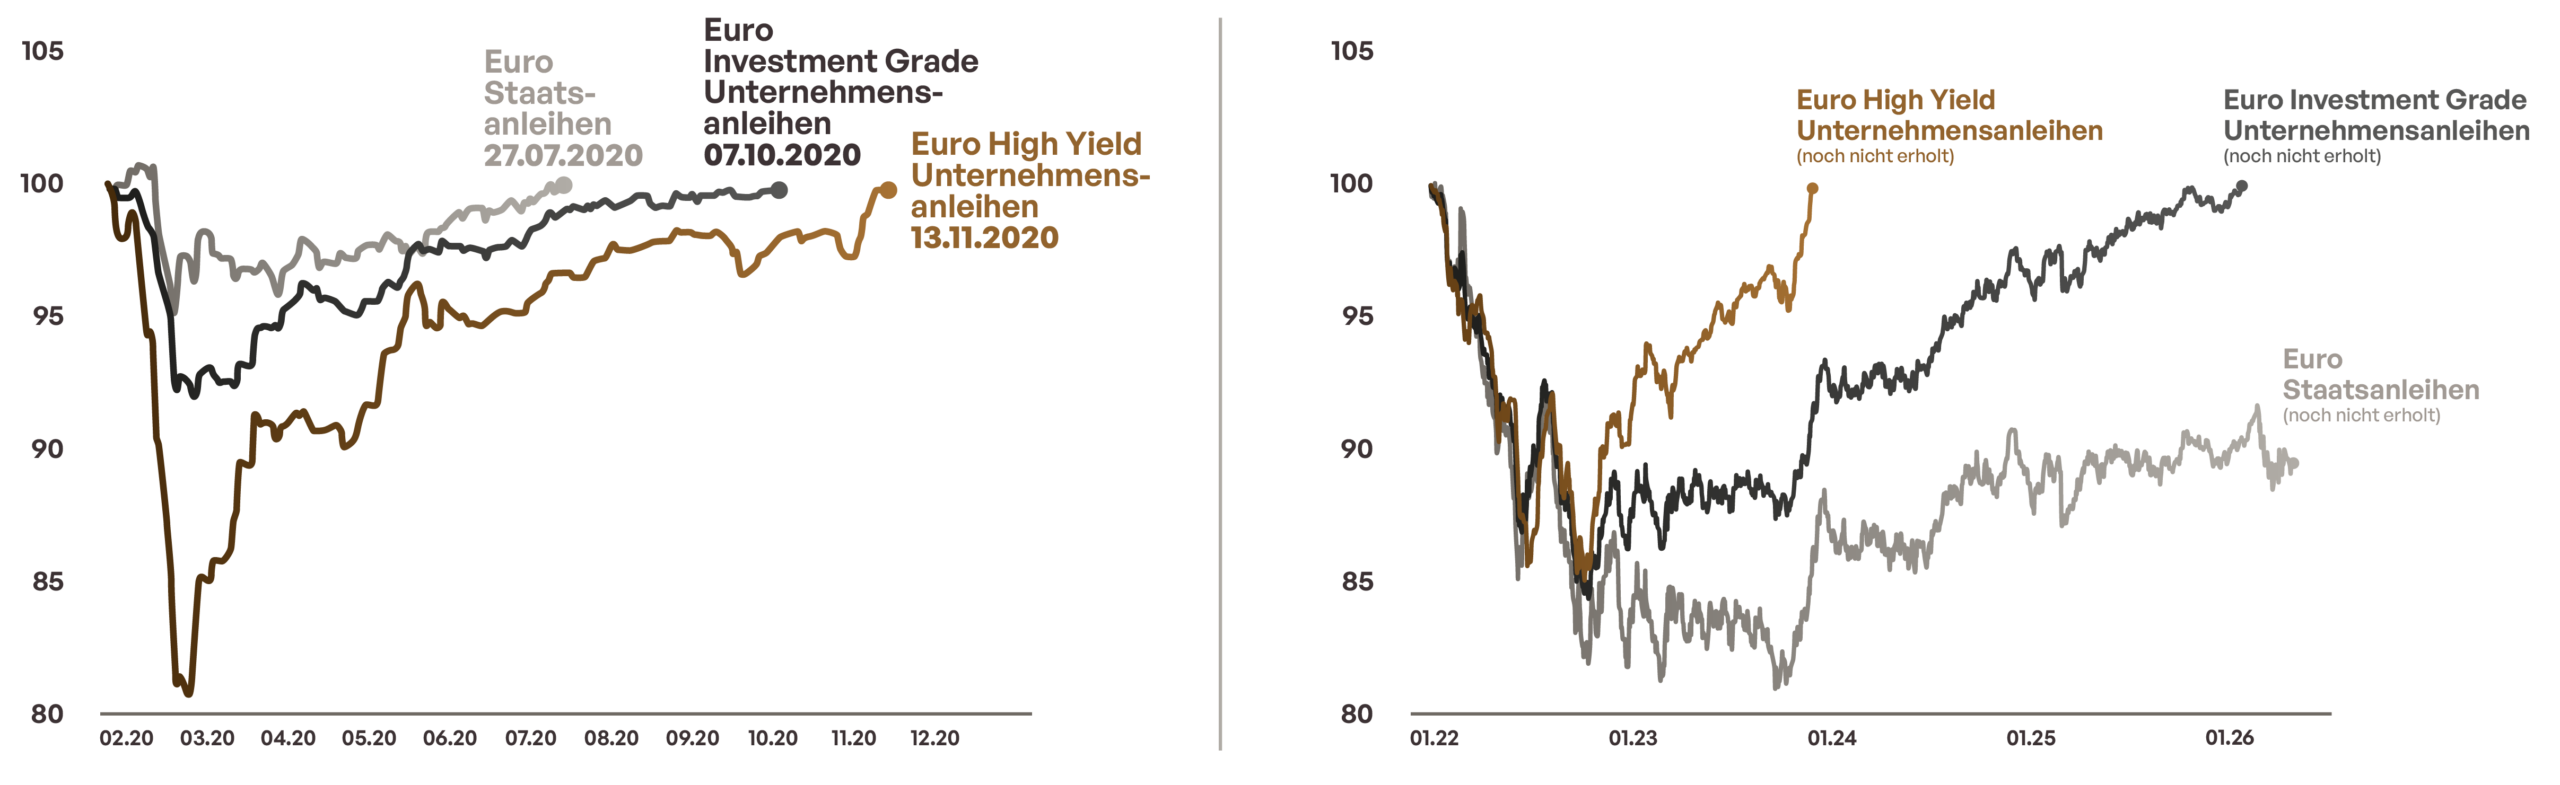
Source for Figure 1: Bloomberg, Euro Gov. (LEATTREU Index), Eur Corporate NF (LECFTREU Index), and Euro High Yield (H23969EU Index); As of February 25, 2020, through December 31, 2020
Source for Chart 2: Bloomberg, Euro Gov. (LEATTREU Index), Eur Corporate NF (LECFTREU Index), and Euro High Yield (H23969EU Index); As of January 5, 2022, through May 1, 2026
| Market | Index | 7/2025– 7/2026 | 7/2024– 7/2025 | July 2023– , July 2024 | July 2022– y 2023 | July 2021– , July 2022 |
|---|---|---|---|---|---|---|
| Euro-denominated government bonds | Bloomberg EuroAgg Treasury Total Return Index Value Unhedged EUR | -0,21% | +1,91% | +4,94% | -8,66% | -10,72% |
| Euro-Denominated Investment-Grade Corporate Bonds | Bloomberg Euro Corporate Unh EUR | +1,03% | +4,81% | +7,15% | -3,35% | -9,31% |
| Euro High-Yield Corporate Bonds | Bloomberg Euro HY ex Financials BB-B 3% Capped TR Index Hedged EUR | +3,07% | +7,50% | +9,71% | +6,37% | -9,37% |
Our historical analysis shows that a targeted allocation to Euro High Yield ex CCC can improve the risk-return profile. In the model calculation, a portfolio with a 20% allocation to high-yield bonds achieved an annualized return approximately 50 basis points higher than the initial allocation—with nearly the same volatility. A 10% allocation was associated with both a higher return and slightly lower volatility over the period under review.
Thus, the role of high-yield bonds is not limited to attractive current yields and typically lower interest-rate sensitivity compared with traditional investment-grade bonds. When used in moderation, this asset class can contribute to diversification and enhance the risk efficiency of the overall portfolio.
High-Yield as a Strategic Allocation
Risk-Return Profile for EUR Fixed Income: Strategic High-Yield Allocation Pays Off

Source: Own calculations; Bloomberg (Euro Aggregate TR, Euro HY ex CCC TR), monthly data. Realized return p.a. calculated to the day (365.25 days/year); volatility = annualized standard deviation of monthly returns (×√12). Portfolio: 80% IG / 20% HY, rebalanced quarterly. Last observation: July 31, 2026. Observation period: 03/2021 – 07/2026
| Market | Index | 7/2025– 7/2026 | 7/2024– 7/2025 | July 2023– , July 2024 | July 2022– y 2023 | July 2021– , July 2022 |
|---|---|---|---|---|---|---|
| Euro-Denominated Government Bonds and Investment-Grade Bonds | Bloomberg EuroAgg Index | +0,20% | +2,68% | +5,50% | -7,30% | -10,42% |
| Euro High-Yield Corporate Bonds | Bloomberg Euro High Yield ex Financials BB-B 3% Capped Total Return Index | +3,07% | +7,50% | +9,71% | -6,37% | -9,37% |
Risks
Price losses due to increases in yields and/or higher risk premiums are possible. A total loss cannot be ruled out either.
Past performance is not an indication of future results, nor can future performance be guaranteed.
Disclaimer
This marketing communication within the meaning of the German Securities Trading Act
(Wertpapierhandelsgesetz) is provided for information purposes only and should not be construed
as personal investment advice or a recommendation or solicitation to buy, sell or hold
any financial instrument or to adopt any investment strategy. The opinions and statements
contained in this document reflect the current assessment on the date of publication. This information does not constitute a complete analysis of all material facts relating to any country,
region or market. This is not to be considered as financial analysis.
If statements are made about market developments, returns, price gains or other asset
growth as well as risk ratios, these merely constitute forecasts for whose occurrence we assume
no liability. Past performance, simulations or forecasts in particular are not a reliable
indicator of future performance. Assets can go up as well as down. All information has been carefully compiled; partly with recourse to information from third parties.Individual details may prove to be no longer or no longer fully accurate, in particular as a result of the passage of time, changes in the law, current developments on the markets, possibly at short notice, and may change at any time without prior notice. Therefore, no guarantee is given that all the information is correct, complete and up to date.
Please inform yourself independently about all costs relevant to you. Maintaining a custody
account may incur costs; ongoing bank charges may also be incurred. Transaction costs depend
on the asset class: For government bonds and collateralised bonds such as mortgage
bonds, they average around 0.02 percent, for corporate bonds 0.085 percent. For less liquid
bonds, the transaction costs can also be significantly higher than 0.25 per cent. It should also
be noted that transaction costs can temporarily be significantly higher during periods of market
stress. For all products sold by HAGIM, all relevant cost information is made available
prior to purchase.
The information is based on our assessment of the current legal and tax situation. If tax or
legal matters are affected, these should be discussed by the addressee with their tax advisor
or lawyer. Investments in financial instruments are associated with both opportunities and
risks. The handling of conflicts of interest at HAGIM is published online in the legal notice on
https://www.ha-gim.com/en/legal-information. The information contained in this document
is intended for professional clients and eligible counterparties only. This information document
is not directed at US citizens or permanent residents, nor to legal entities domiciled in
the USA, nor may it be distributed in the US.